| Issue |
A&A
Volume 653, September 2021
|
|
|---|---|---|
| Article Number | A28 | |
| Number of page(s) | 6 | |
| Section | Stellar atmospheres | |
| DOI | https://doi.org/10.1051/0004-6361/202039203 | |
| Published online | 02 September 2021 | |
Lithium abundance in a sample of active stars: High-resolution spectrograph observation with the 1.8 m telescope
1
Yunnan Astronomical Observatories, Chinese Academy of Sciences,
Kunming
650216,
PR China
e-mail: This email address is being protected from spambots. You need JavaScript enabled to view it.
2
Key Laboratory for the Structure and Evolution of Celestial Objects, the Chinese Academy of Sciences,
650011
KunMing,
PR China
3
University of Chinese Academy of Sciences,
Beijing
100049,
PR China
Received:
18
August
2020
Accepted:
8
July
2021
Abstract
Context. Observations of young, low-mass, main-sequence, and zero-age main-sequence stars show evidence of a correlation between lithium abundance and chromospheric activity, albeit with a very large scatter. Fast rotation stars (including T Tauri stars, RS CVn, and BY Dra systems) show the Li I doublet at 6707.8 Å in their spectra. The lithium depletion is probably related to the rotation (turbulent diffusion induced by rotation). Because the flare activity of stars increases with decreasing rotation period, a correlation can be expected between lithium abundance and chromospheric activity for active stars.
Aims. The aim of this paper is to investigate the relation between lithium abundance and the Ca II H and K emission index (R′HK = LHK/Lbol) for a sample of active stars.
Methods. Based on the high-resolution spectroscopic observations, we calculated lithium abundance for 14 chromospherically active late-type stars using the comparison of the measured Li I λ670.8 nm equivalent width with curve of growth calculations in non-local-thermodynamic-equilibrium conditions. We also searched the correlation between lithium abundance and the Ca II H & K emission index (log R′HK) for the 14 chromospherically active late-type stars.
Results. The study of the relationship between lithium abundance and the Ca II H & K emission index (log R′HK) found that the activity of sample stars increases with increasing lithium abundance. Next, the lithium abundance analogs progressively decrease as the rotation periods increase (rotation becomes slow) and the large values of the log R′HK along with small values of Rossby numbers for the sample of chromospherically active stars.
Conclusions. The lithium abundance (log N(Li)) versus the chromospheric activity and log N(Li) against the rotation period both indicate that the lithium abundance analogs progressively increase as the chromospheric activity index increases and/or the rotation velocity increase (rotation period becomes small) for our sample of active stars. On the other hand, the log R′HK against the Rossby number RO shows that there is a clear trend of increasing activity with increasing rotation velocity for these active stars. Considering that the lithium abundance decreases with increasing stellar age in late-type stars, we can deduce that the chromospheric activity and the rotation velocity both decrease with the increase of stellar age for our sample active stars.
Key words: stars: abundances / stars: evolution / stars: late-type
© ESO 2021
1 Introduction
In the study of the chemical evolution of the Universe, lithium is a key element. Inside stellar interiors, lithium is an extraordinarily sensitive diagnostic of the structure and the mixing processes, since it is easily burned at relatively low temperatures (2.5 × 10⁶ K).
The observations of young, low-mass main-sequence (MS; e.g., Rebolo & Beckman 1988; Chaboyer 1998) and zero-age MS (ZAMS) stars in the Pleiades (e.g., Tschäpe & Rüdiger 2001) clearly reveal that fast rotator appears to be less Li-depleted than equal-mass slow rotators. On the other hand, it is well known that the photospheric lithium abundance decreases with increasing stellar age in late-type stars (Herbig 1965; Bodenheimer 1965). Therefore, lithium abundance has been used as a stellar age indicator for young solar mass stars (e.g., Herbig 1965; Duncan 1981; Soderblom 1983; Xing & Xing 2012). The model predicted and the observations indicate that just after their arrival on the ZAMS, stars undergo an efficient braking. This means that low-mass stars spin down during their main-sequence evolution (Xing 2010; Bouvier 1994; Soderblom et al. 1993; Cemeron et al. 1995; Keppens et al. 1995). Thus, the observed stellar rotation may also be a good age indicator (Genya et al. 2007).
The high-resolution spectra and high-precision photometry observations for single, late-type MS stars also show that chromospherically active solar-type stars have high lithium abundances (Pasquini et al. 1994; Favata et al. 1993, 1995; Tagliaferri et al. 1994, 2000; Jeffries 1995). The study of activity-rotation for late-type stars indicates that the flare activity increases with decreasing rotation period (e.g. Montes et al. 2001; Böhm-Vitense 2007; Suárez et al. 2016; Metcalfe & van Saders 2017). Hence, like lithium abundance and rotation rates, stellar activity is also considered a good indicator of age for late-type stars (Soderblom et al. 1991; Pizzolato et al. 2000).
Fast rotation stars (including T Tauri stars, RS CVn, and BY Dra systems) display a high level of activity with strong chromospheric line emissions. Moreover, active binary systems like RS CVn and BY Dra systems show the Li I doublet at 6707.8 Å in their spectra (e.g., Spite et al. 1984; Randich & Pallavicini 1991). In addition, the lithium depletion is probably related to the rotation (turbulent diffusion induced by rotation). Therefore, a correlation can be expected between lithium abundance and chromospheric activity for active stars.
The 1.8 m telescope at the Yunnan Astronomical Observatories, Chinese Academy of Science (hereafter YAOC) in Lijiang has a 127 element adaptive optical (AO) system. The AO systems have a deformable mirror to reduce the aberrations caused by atmospheric turbulence and telescope optics (Wei et al. 2010). The Coudé Echelle Spectrograph of the YAOC is used at the coudé focus of the 1.8 m telescope. The high-resolution (R = λ∕Δλ = 20 000 ~ 50 000) Coudé Echelle Spectrograph, coupled with a large, single 2K × 2K CCD format (pixel size of 13.5 μm), is sufficient to cover a wavelength range of 560–1100 nm in a single shot at a resolution of R = 37 000. The limiting magnitude for a 1-h exposure with an S/N (signal-to-noise ratio) ≥40 scales to V = 11.5 at λ = 600 nm.
Based on the high-resolution spectroscopic observations with the 1.8 m Optical Telescope located at the Lijiang observatory for a sample of chromospherically active stars, we tried to test whether any correlation exists between the lithium abundances and the chromospheric activity index (log  ). This paper is organized as follows. The observations and data reduction are presented in Sect. 2. The analysis is provided in Sect. 3. The discussions and results are presented in Sect. 4.
2 Observations and data reduction
To investigate the correlation between the lithium abundance and the chromospheric activity for the chromospherically active late-type stars, we selected a sample of 14 active stars. These sample active stars were selected from the cross-correlation of the ROSAT X-ray catalog and the Tycho catalog, and they are strong X-ray sources that have been identified as late-type stars. Spectroscopic observations of these 14 sample stars were performed from October 21, 2015 to March 31, 2016 with the Coudé Echelle Spectrograph attached to the 1.8 m telescope at the Lijiang observatory of the YAOC. The spectrograph was used with a 31.6 grooves/mm grating and a 2k × 2k Tek CCD chip with 13.5 × 13.5μm pixels. The slit width was 0.5 mm (1.3 arcsec). The resolving power is λ∕δλ = 37 000, and δλ = 0.162Å at 6000 Å, with a spectral coverage of 5600 Å to 11 000 Å. The high-resolution spectra of all target stars were taken with a longer exposure time in order to achieve a high signal-to-noise ratio (S/N was larger than 100). This relatively high resolution was judged to be important in view of the relatively weak lithium lines in some stars.
All observational data were reduced using the standard procedures in the image reduction and analysis facility (IRAF) package (bias subtraction, extraction of scattered light produced by the optical system, division by a normalized flat-field, wavelength calibration, and continuum fitting). Figure 1 shows a portion of the spectrum of four sample stars around 6707.8 Å. The equivalent width (EW) of the Li I λ 6707.8 Å line was determined by the fitting of a Gaussian function.
In Fig. 2, we compare our measurement of the EW(Li) with those obtained by other authors (da Silva et al. 2009; Takeda & Kawanomoto 2005; Xing 2010; Xing & Xing 2012; Xing et al. 2012). The relation between the equivalent width in the literature and those based on the Lijiang spectra appears to be well defined: the rms scatter around the line shown in Fig. 2 is less than 3 mÅ.
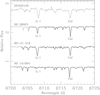 |
Fig. 1 Spectra in the Li I λ 6707 Å line region for some of the sample stars. |
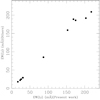 |
Fig. 2 Equivalent widths of the Li I λ 6708 line measured from Lijiang spectra compared to equivalent widths given by other authors (da Silva et al. 2009; Takeda & Kawanomoto 2005; Xing 2010; Xing & Xing 2012; Xing et al. 2012). |
3 Lithium abundance
3.1 Effective temperature and surface gravity
The effective temperature of 14 sample stars was determined from the (B-V) color index using the calibrations of Casagrande et al. (2006). The effective temperature of program stars is listed in Table 1.
Using the relations between g ∝ M∕R2 and  , we obtain the surface gravity of 14 sample stars:
 (1)
(1)
where g⊙, M⊙, Teff,⊙, and L⊙ are the solar surface gravity, mass, photometric effective temperature, and luminosity, respectively. M, R, Teff, and L are the stellar mass, radius, photometric effective temperature and luminosity, respectively, in the respective solar units.
Here, the luminosity of sample stars is given by:
 (2)
(2)
where r and m are the distance to star and the apparent magnitude of the star, respectively. The distance of stars was derived from the trigonometric parallax searched from VizieR. The mass was estimated from star’s position in the log(L∕L⊙) − log Teff diagram using the PMS evolutionary models of Palla & Stahler (1999).
Li abundances and the chromospheric activity index (log  ) for 14 active stars.
3.2 Calculation of lithium abundance
The measured Li I λ 670.8 nm EW was converted into lithium abundances (on a scale where Log N(H) = 12.00) using the curves of growth computed by Pavlenko & Magazzü (1996), which were based on the atmospheric models withsolar metallicity of Kurucz (1993). These curves span the temperatures 3500–6000 K, with gravity 3.0 < log g < 4.5, as described by Xing (2010). The lithium abundance of 14 chromospherically active stars is reported in Table 1.
The main source of error in the derived log N(Li) values is theuncertainty regarding the effective temperature. It is known that the lithium abundance is very sensitive to the effective temperature, whereas their dependence on the other parameters, such as metallicity ([Fe/H]), gravity, and microturbulence is negligible. The common uncertainties on metallicity ([Fe/H]), gravity, and microturbulence ([Fe/H] ~ ±0.05 dex, log g ~ ± 0.07 dex and ξ ~ ± 0.1 km s−1) will not affect the final lithium abundance. Following the uncertainty analysis of Martín et al. (1994), we can estimate the mean uncertainty of log N(Li). An uncertainty of ±70 K in Teff results in an uncertainty of ≤ ±0.15 dex in the abundance.
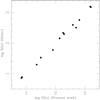 |
Fig. 3 Comparison of log N(Li) of sample stars derived by Thevenin (1998), da Silva et al. (2009), Mishenina et al. (2008, 2012), Takeda & Kawanomoto (2005), Xing (2010), Xing & Xing (2012), and Xing et al. (2012) with this work. |
4 Discussion and result
Figure 3 shows a comparison of the lithium abundance of this work with those published by other authors (Thevenin 1998; da Silva et al. 2009; Xing 2010; Mishenina et al. 2008, 2012; Takeda & Kawanomoto 2005; Xing et al. 2012). As expected, there are only minor differences. We are confident that the lithium abundances in this work are reliable.
In Fig. 4, we plot the lithium abundance (log N(Li)) versus the effective temperature for our sample stars. Also, we show the upper envelope of Pleiades and Hyades stars (the solid and dashed curves are the fiducial lithium abundance versus effective temperature for the Pleiades – top envelope – and Hyades, respectively, adapted from Deliyannis 2000). According to our defined criterion, five of our sample stars (see Fig. 4) can be classified as objects younger than the Pleiades. Four of these five young stars ([LH98]17, HD 23386, HD 282346, and BD+21 418) were previously known to be weak-line T Tauri star (WTTS) candidates (Li & Hu 1998). Another one of the five stars, HD220140, shows evidence that it is an evolved post-T Tau star (PTTS, see Chugainov et al. 1991). Another three stars (HD 82443, HD 141272, and HD 90709) in our sample can be classified as objects younger than the Hyades but older than the Pleiades. The remaining six stars (HD 35984, HD 26923, HD 141004, HD 133640,HD 101501, and HD 111395) in the sample (see Fig. 4) can be classified as objects older than the Hyades.
The chromospheric activity index, log  (
( is the chromospheric flux or “flux excess” in the Ca II H+K lines), of 14 sample stars is taken from the literature. The chromospheric activity index (log
  ) and the references of sample stars are listed in Table 1. All of these log
  indices are derived from a band ratio measurement of the Ca H and K emission line strength (the “S-index” or, when converted to the Mount Wilson system, SMW). Mamajek & Hillenbrand (2008) pointed out that the final errors in the derived log
  for single observations due to measurement uncertainty and calibration of the program stars are ~0.1 dex. Considering the variation in the observable S through a whole variability cycle of Ca II flux variability induce by the physical mechanisms, estimated variations correspond to ~0.15 in log
  (Mamajek & Hillenbrand 2008).
In order to search the correlation between lithium abundance and chromospheric activity, we plot the lithium abundance (log N(Li)) versus the chromospheric activity index for 14 chromospherically active stars in Fig. 5. Figure 5 was constructed using the lithium and chromospheric activity index data in Table 1 and adopting a linear model. The correlation coefficient is 0.50, which is at the widely accepted minimum value for a moderate correlation. The R-squared value is 0.25, which means the linear model explains about 25% of the variability in the response, suggesting the presence of other predictor variables that are not included in this linear fit. The p-value for the fit is 0.07, which does not meet the significance level for the null hypothesis of 5%. The statistics are consistent with the plot in Fig. 5 that shows the fit with rather broad 95% confidence bounds. The statistical assessment also indicates that the surface Li abundances of these active stars’ analogs progressively increase as the chromospheric activity index increases, albeit with a large scatter. This result supports that of Fernandez-Figueroa et al. (1993): as the chromospheric flux becomes stronger, the lithium abundance increases.
We took the rotational periods of the fourteen sample stars from Norton et al. (2007), Bouvier et al. (2018), Byrne et al. (1984), Kahanpaeae et al. (1999), Isaacson & Fischer (2010), Raghavan et al. (2010), Baliunas et al. (1996), and Rutten (1987). In Fig. 6, we plot the lithium abundance (log N(Li)) versus the rotation period for 14 chromospherically active sample stars. The figure indicates that the lithium abundance of these active stars’ analogs progressively decreases as the rotation periods increase (rotation becomes slow), albeit with a large scatter. The result supports the fact that the faster the stellar rotation is, the smaller the lithium depletion is for low-mass MS stars (e.g., Rebolo & Beckman 1988; Chaboyer 1998).
Since (as Noyes et al. 1984 demonstrated that at least) the chromospheric activity of late-type stars could be best understood in terms of the so-called Rossby number, that is the ratio of stellar rotation period to convective turnover time. Following Mittag et al. (2018), we used the dependence of the convective turnover time τc versus B −V-colour in the following form:
 (3)
(3)
for stars with colors in the 0.44 ≤ B − V ≤ 0.71 range, and for stars with B − V > 0.71,
 (4)
(4)
obtains the convective turnover time τc from the B − V color of every sample star. Furthermore, using the ratio of the rotation period (Prot) to convective turnover time (τc), that is RO = Prot/τc, we obtain the Rossby number (RO) for the sample stars.
In Fig. 7, we plot the log  against the Rossby number, RO, for 14 sample stars. As expected, large values of the log
  go along with small values of Rossby numbers for these chromospherically active stars. The result supports the notion that there is a clear trend of increasing activity with increasing rotation (since the faster a star rotates, the smaller the values of the Rossby number are; Mishenina et al. 2010; Ambruster et al. 1998; Montes et al. 2001; Takeda et al. 2010; Mittag et al. 2018; Noyes et al. 1984) for late-type stars.
In Fig. 8, we plot the log N(Li) versus the Rossby number, RO, for 14 sample stars. It bears a strong resemblance to the lithium abundance versus rotation period in Fig. 6. As expected, large values of logN(Li) go along with small values of Rossby numbers for these chromospherically active stars. The result also supports the fact that the lithium abundance of these active stars’ analogs progressively decreases as the rotation periods increase (rotation becomes slow), albeit with a large scatter (since the faster the stellar rotation, the smaller the values of the Rossby number for late-type stars; Mishenina et al. 2010; Ambruster et al. 1998; Montes et al. 2001; Takeda et al. 2010; Mittag et al. 2018; Noyes et al. 1984).
To summarize what has been mentioned above, the lithium abundance of our sample active stars’ analogs progressively increases as the chromospheric activity index increases and/or the rotation periods decrease, just as for late-type young MS stars. The figure of lithium abundance versus the rotation period of 14 sample stars is understandable in the context of lithium depletion and convection zone depth. However, the origin of this correlation and the relationship between log N(Li) and the Rossby number is less clear, but apparently present. Perhaps this is because for both parameters lithium abundance and rotation periods are correlated with stellar age, combined with the possible influence of rotation-induced turbulent diffusion. Considering that the lithium abundance decreases with increasing stellar age in late-type stars (Herbig 1965; Bodenheimer 1965), we can deduce that the chromospheric activity and the rotation velocity both decrease with the increasing stellar age for these sample active stars. Therefore, as with the lithium abundance and rotation rate, stellar activity is also considered a good indicator of age for active stars. Because the τc varies rapidly with time in the pre-main sequence (PMS) phase (Kim & Demarque 1996), the fact that the values of log  of three PMS stars (HD 23386, HD 220140 and HD 35984) is higher than that of other stars with similar Rossby numbers (RO) in Fig. 6, is not surprising.
We notice that the lithium abundance of one of our sample stars, HD 220140 (a RS CVn binaries system), is derived by Mishenina et al. (2012) and Stonkute et al. (2020) as 2.3 and 2.5, respectively. The lithium-abundance difference is up to 0.2 dex. Soriano et al. (2015) found a rotationally modulated lithium abundance and a systematic redshift of the lithium line center during higher activity of the fast-rotating, single K2 dwarf, LQ Hya. These support the hypothesis that fresh lithium is produced byflares. As with the lithium-abundance variation of the higher activity dwarf, LQ Hya, a slightly higher value of log N(Li) = 2.5 for HD 220140 should be caused by fresh lithium, which is produced by flares.
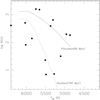 |
Fig. 4 Li abundance versus effective temperature for stars in the present work. The solid and dashed curves are the fiducial log N(Li) vs. Teff curves for the Pleiades (top envelope) and Hyades, respectively (adapted from Deliyannis 2000). |
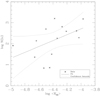 |
Fig. 5 Lithium abundance as a function of the chromospheric activity index (log |

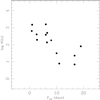 |
Fig. 6 Lithium abundance as a function of the rotation period (Prot) for the 14 chromospherically active sample stars. |
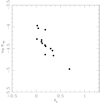 |
Fig. 7 Chromospheric activity index (log |

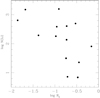 |
Fig. 8 Lithium abundance as a function of the logarithm of Rossby number (log RO = Prot∕τc) for the 14 chromospherically active sample stars. |
5 Conclusions
In this paper, we present high-resolution spectroscopic observations of a sample of 14 chromospherically active late-type stars. Based on these observations, we derived the lithium abundances for these 14 sample stars. The lithium abundance (log N(Li)) versus the chromospheric activity and log N(Li) against the rotation period both indicate that the lithium abundances analogs progressively increase as the chromospheric activity index increases and/or the rotation periods decrease (rotation becomes fast) for these active stars. On the other hand, the log  against the Rossby number RO shows that there is a clear trend of increasing activity with increasing rotation velocity for these chromospherically active stars. Considering that the lithium abundance decreases with increasing stellar age in late-type stars (Herbig 1965; Bodenheimer 1965), we can deduce that the chromospheric activity and the rotation velocity both decrease with the increasing of stellar age for these active stars.
Acknowledgements
We would like to thank an anonymous referee for valuable comments and suggestions that helped to improve this manuscript significantly. We would also like to thank Prof. Zhanwen Han and Gang Zhao for beneficial discussions. This work was supported by the joint funding of Astronomy of the National Natural Science Foundation of China and the Chinese Academy of Sciences, under Grants No. U1831125 and funding of the National Natural Science Foundation of China under Grants No. E1110101.
References
- Ambruster, C. W., Brown, A., Fekel, F. C., et al. 1998, in The Tenth Cambridge Workshop on Cool stars, Stellar Systems, and the Sun, eds. R. A., Donahue, & J. A., Bookbinder, ASP Conf. Ser., 154, CD-1205 [NASA ADS] [Google Scholar]
- Baliunas, S., Sokoloff, D., & Soon, W. 1996, ApJ, 457, 99 [Google Scholar]
- Bodenheimer, P. 1965, ApJ, 142, 451 [NASA ADS] [CrossRef] [Google Scholar]
- Böhm-Vitense, E. 2007, ApJ, 657, 486 [NASA ADS] [CrossRef] [Google Scholar]
- Boro, S. S., Marvin, C. J., & Jeffers, S. V. 2018, A&A, 616, A108 [NASA ADS] [CrossRef] [EDP Sciences] [Google Scholar]
- Bouvier, J. 1994, ASPC, 64, 151 [Google Scholar]
- Bouvier, J., Barrado, D., Moraux, E., et al. 2018, A&A, 613, A63 [NASA ADS] [CrossRef] [EDP Sciences] [Google Scholar]
- Brewer, J. M., Fischer, D. A., Valenti, J. A., et al. 2016, ApJS, 225, 32 [NASA ADS] [CrossRef] [Google Scholar]
- Byrne, P. B., Doyel, J. G., & Butler, C. J. 1984, MNRAS, 206, 907 [NASA ADS] [CrossRef] [Google Scholar]
- Casagrande, L., Portinari, L., & Flynn, C. 2006, MNRAS, 373, 13 [NASA ADS] [CrossRef] [Google Scholar]
- Cemeron, A. C., Campbell, C. G., & Quaintrell, H. 1995, A&A 298, 133 [NASA ADS] [Google Scholar]
- Chaboyer, B. 1998, in IAU Symp. 185, New Eyes to See Inside the Sun and Stars: Pushing the Limits of Helio and Astero-Seism, eds. D. W. Kurtz, J. Christensen-Dalsgaard, & D. Kurtz (Dordrecht: Kluwer) [Google Scholar]
- Chugainov, P. F., Lovkaya, M. N., & Petrov, P. P. 1991, IBVS, 3623, 1 [Google Scholar]
- da Silva, L., Torres, C. A. O., de La Reza, R., et al. 2009, A&A, 508, 833 [NASA ADS] [CrossRef] [EDP Sciences] [Google Scholar]
- Deliyannis, C. P. 2000, ASPC, 198, 235 [Google Scholar]
- Duncan, D. K. 1981, ApJ, 248, 651 [NASA ADS] [CrossRef] [Google Scholar]
- Favata, F., Barbera, M., Micela, G., et al. 1993, A&A, 277, 428 [NASA ADS] [Google Scholar]
- Favata, F., Barbera, M., Micela, G., et al. 1995, A&A, 295, 147 [NASA ADS] [Google Scholar]
- Fernandez-Figueroa, M. J., Barrado, D., De Castro, E. & Cornide, M. 1993, A&A, 274, 373 [NASA ADS] [Google Scholar]
- Gagné, J., Plavchan, P., Gao, P., et al. 2016, ApJ, 822, 40 [Google Scholar]
- Genya, T., Eric, B. F., Alison, S., et al. 2007, ApJS, 168, 297 [NASA ADS] [CrossRef] [Google Scholar]
- Herbig, G. H. 1965, ApJ, 141, 588 [NASA ADS] [CrossRef] [Google Scholar]
- Herrero, E., Ribas, I., Jordi, C., et al. 2012, A&A, 537, A147 [NASA ADS] [CrossRef] [EDP Sciences] [Google Scholar]
- Isaacson, H., & Fischer, D. 2010, ApJ, 725, 875 [NASA ADS] [CrossRef] [Google Scholar]
- Jeffries, R. D. 1995, MNRAS, 273, 559 [NASA ADS] [Google Scholar]
- Kahanpaeae, J., Jetsu, L., Alha, L., et al. 1999, A&A, 350, 513 [NASA ADS] [Google Scholar]
- Keppens, R., MacGregor, K. B., & Charbonneau, P. 1995, A&A 294, 469 [NASA ADS] [Google Scholar]
- Kim, Y. C., & Demarque, P. 1996, ApJ, 457, 340 [NASA ADS] [CrossRef] [Google Scholar]
- Kurucz, R. L. 1993, ATLAS9 Stellar Atmosphere Program and 2km s−1 Grid (Kurucz CD-ROM No. 13) [Google Scholar]
- Li, J. Z., & Hu, J. Y. 1998, A&AS, 132, 173 [NASA ADS] [CrossRef] [EDP Sciences] [Google Scholar]
- Mamajek, E. E., & Hillenbrand, L. A. 2008, ApJ, 687, 1264 [NASA ADS] [CrossRef] [Google Scholar]
- Martín, E. L., Rebolo, R., Magazzú, A., et al. 1994, A&A, 282, 503 [Google Scholar]
- Metcalfe, T. S., & van Saders, J. 2017, SoPh, 292, 126 [NASA ADS] [Google Scholar]
- Mishenina, T. V., Soubiran, C., & Bienaymé, O. 2008, A&A, 489, 923 [NASA ADS] [CrossRef] [EDP Sciences] [Google Scholar]
- Mishenina, T. V., Soubiran, C., Kovtyukh, V. V., & Belik, S. I. 2010, Proc. IAU, 268, 343 [NASA ADS] [Google Scholar]
- Mishenina, T. V., Soubiran, C., Kovtyukh, V. V., et al. 2012, A&A, 547, A106 [NASA ADS] [CrossRef] [EDP Sciences] [Google Scholar]
- Mittag, M. M., Schmitt, J. H. M. M., & Schröder, K. P. 2018, A&A, 618, A48 [NASA ADS] [CrossRef] [EDP Sciences] [Google Scholar]
- Montes, D., López-Santiago, J., & Fernández-Figueroa, M. J. 2001, A&A, 379, 976 [NASA ADS] [CrossRef] [EDP Sciences] [Google Scholar]
- Norton, A. J., Wheatley, P. J., West, R. G., et al. 2007, A&A, 467, 785 [NASA ADS] [CrossRef] [EDP Sciences] [Google Scholar]
- Noyes, R. W., Hartmann, L. W., Baliunas, S. L., et al. 1984, ApJ, 279, 763 [NASA ADS] [CrossRef] [Google Scholar]
- Palla, F., & Stahler, S. W. 1999, ApJ, 525, 772 [NASA ADS] [CrossRef] [Google Scholar]
- Pasquini, L., Liu, Q., & Pallavicini, R. 1994, A&A, 287, 191 [NASA ADS] [Google Scholar]
- Pavlenko, Ya. V., & Magazzü, A. 1996, A&A, 311, 961 [NASA ADS] [Google Scholar]
- Pizzolato, N., Maggio, A., & Sciortino, S. 2000, A&A, 361, 614 [NASA ADS] [Google Scholar]
- Radick, R. R., Lockwood, G. W., Henry, G. W., et al. 2018, ApJ, 855, 75 [Google Scholar]
- Raghavan, D., McAlister, H. A., Henry, T. J., et al. 2010, ApJS, 190, 1 [NASA ADS] [CrossRef] [EDP Sciences] [Google Scholar]
- Randich, S., & Pallavicini, R. 1991, Mem. Soc. Astron. Ital., 62, 75 [NASA ADS] [Google Scholar]
- Rebolo, R., & Beckman, J. E. 1988, A&A, 201, 267 [NASA ADS] [Google Scholar]
- Rutten, R. G. M. 1987, A&A, 177, 131 [NASA ADS] [Google Scholar]
- Soderblom, D. R. 1983, ApJS, 53, 1 [NASA ADS] [CrossRef] [Google Scholar]
- Soderblom, D. R., Duncan, D. K., & Johnson, D. R. H. 1991, ApJ, 355, 722 [NASA ADS] [CrossRef] [Google Scholar]
- Soderblom, D. R., Stauffer, J. R., MacGregor, K. B., et al. 1993, ApJ, 409, 624 [NASA ADS] [CrossRef] [Google Scholar]
- Soriano, M. F., Strassmeier, K. G., & Weber, M. 2015, A&A, 575, A57 [NASA ADS] [CrossRef] [EDP Sciences] [Google Scholar]
- Spite, M., Maillard, J. P., & Spite, F. 1984, A&A, 141, 56 [NASA ADS] [Google Scholar]
- Stonkute, E., Chorniy, Y., & Tautvaisiene, G., et al. 2020, AJ, 159, 90 [CrossRef] [Google Scholar]
- Suárez Mascareño, A., Rebolo, R., & González Hernández, J. I. 2016, A&A, 595, A12 [NASA ADS] [CrossRef] [EDP Sciences] [Google Scholar]
- Tagliaferri, G., Cutispoto, G., Pallavicini, R. et al. 1994, A&A, 285, 272 [NASA ADS] [Google Scholar]
- Tagliaferri, G., Pastori, L., Cutispoto, G., et al. 2000, in The Light Elements and their Evolution, eds. L. da Silva, R. de Medeiros, & M. Spite, IAU Symp., 198, 366 [Google Scholar]
- Takeda, Y., & Kawanomoto, S. 2005, PASJ, 57, 45 [NASA ADS] [Google Scholar]
- Takeda, Y., Honda, S., Kawanomoto, S., et al. 2010, A&A, 515, A93 [NASA ADS] [CrossRef] [EDP Sciences] [Google Scholar]
- Thevenin, F. 1998, Vizier Online Data Catalog: III/193 [Google Scholar]
- Tschäpe, R., & Rüdiger, G. 2001, A&A, 377, 84 [NASA ADS] [CrossRef] [EDP Sciences] [Google Scholar]
- Wei, K., Zhang, X. J., Xia, n H., et al. 2010, Chinese Opt. Lett., 8, 1019 [Google Scholar]
- White, R. J., Gabor, J. M., & Hillenbrand, L. A. 2007, AJ, 133, 2524 [NASA ADS] [CrossRef] [Google Scholar]
- Xing, L. F. 2010, ApJ, 723, 1542 [NASA ADS] [CrossRef] [Google Scholar]
- Xing, L. F., & Xing, Q. F. 2012, A&A, 537, A91 [NASA ADS] [CrossRef] [EDP Sciences] [Google Scholar]
- Xing, L. F., Zhao, S. Y., & Zhang, X. D. 2012, New Astron., 17, 537 [NASA ADS] [CrossRef] [Google Scholar]
All Tables
All Figures
|
Fig. 1 Spectra in the Li I λ 6707 Å line region for some of the sample stars. |
| In the text | |
|
Fig. 2 Equivalent widths of the Li I λ 6708 line measured from Lijiang spectra compared to equivalent widths given by other authors (da Silva et al. 2009; Takeda & Kawanomoto 2005; Xing 2010; Xing & Xing 2012; Xing et al. 2012). |
| In the text | |
|
Fig. 3 Comparison of log N(Li) of sample stars derived by Thevenin (1998), da Silva et al. (2009), Mishenina et al. (2008, 2012), Takeda & Kawanomoto (2005), Xing (2010), Xing & Xing (2012), and Xing et al. (2012) with this work. |
| In the text | |
|
Fig. 4 Li abundance versus effective temperature for stars in the present work. The solid and dashed curves are the fiducial log N(Li) vs. Teff curves for the Pleiades (top envelope) and Hyades, respectively (adapted from Deliyannis 2000). |
| In the text | |
|
Fig. 5 Lithium abundance as a function of the chromospheric activity index (log |
| In the text | |
|
Fig. 6 Lithium abundance as a function of the rotation period (Prot) for the 14 chromospherically active sample stars. |
| In the text | |
|
Fig. 7 Chromospheric activity index (log |
| In the text | |
|
Fig. 8 Lithium abundance as a function of the logarithm of Rossby number (log RO = Prot∕τc) for the 14 chromospherically active sample stars. |
| In the text | |
Current usage metrics show cumulative count of Article Views (full-text article views including HTML views, PDF and ePub downloads, according to the available data) and Abstracts Views on Vision4Press platform.
Data correspond to usage on the plateform after 2015. The current usage metrics is available 48-96 hours after online publication and is updated daily on week days.
Initial download of the metrics may take a while.