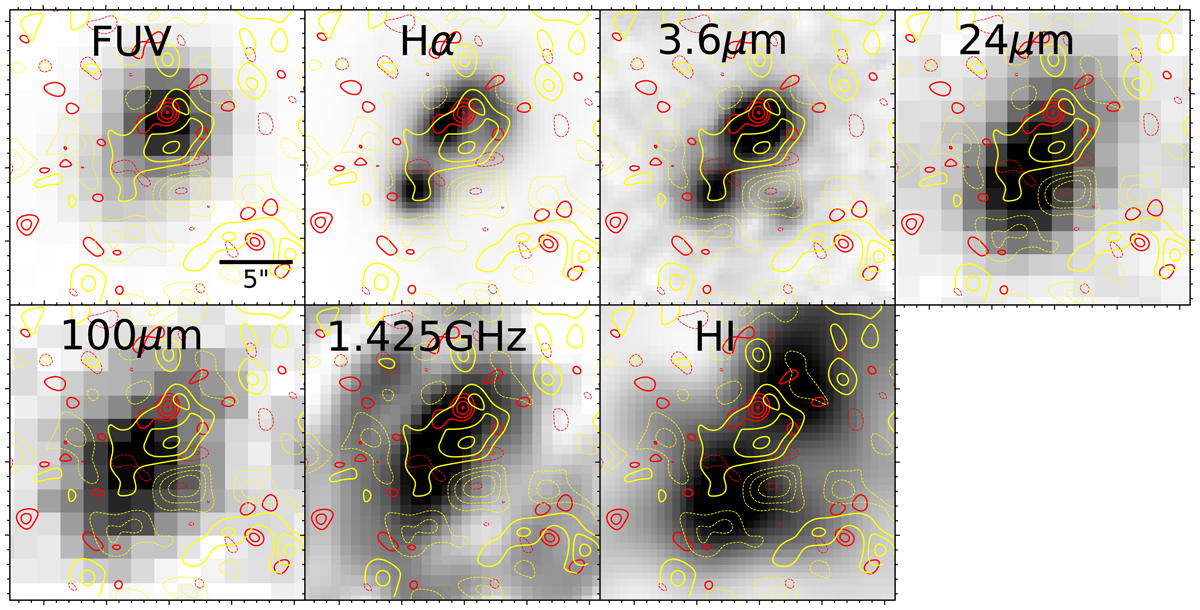
Fig. A.1.
Download original image
Similar to Fig. 1, but CO J = 2-1 emission and 1.3 mm continuum superimposed on the GALEX FUV (Gil de Paz et al. 2007), Hα (Gil de Paz et al. 2003), Spitzer IRAC1 at 3.6 μm (Brown et al. 2014), Spitzer MIPS 24 μm (Brown et al. 2014), Herschel MIPS at 100μm (Fisher et al. 2014), and VLA L-band at 1.425 GHz (Hunt et al. 2005) continuum maps, as well as the H I gas intensity map (Lelli et al. 2012). The CO emission coincides with emissions at FUV, Hα, and radio continuum, which trace star formation, along with stellar emission at 3.6 μm. Meanwhile, the hot and cold dust emission at 24 μm and 100 μm show a slight offset (∼3″) from the CO emission. The extended emission at 1.3 mm generally covers the emission at all bands shown here, except for H I gas. Emission at the 1.3 mm continuum falls between the two peaks of H I gas emission, and CO emission is also shifted from one of the H I peaks by ∼2″. A clear offset is shown between H I gas and CO gas and the 1.3 mm continuum. An offset between CO gas and H I gas has also been observed in another metal-poor galaxy, Sextans B (Shi et al. 2016).
Current usage metrics show cumulative count of Article Views (full-text article views including HTML views, PDF and ePub downloads, according to the available data) and Abstracts Views on Vision4Press platform.
Data correspond to usage on the plateform after 2015. The current usage metrics is available 48-96 hours after online publication and is updated daily on week days.
Initial download of the metrics may take a while.