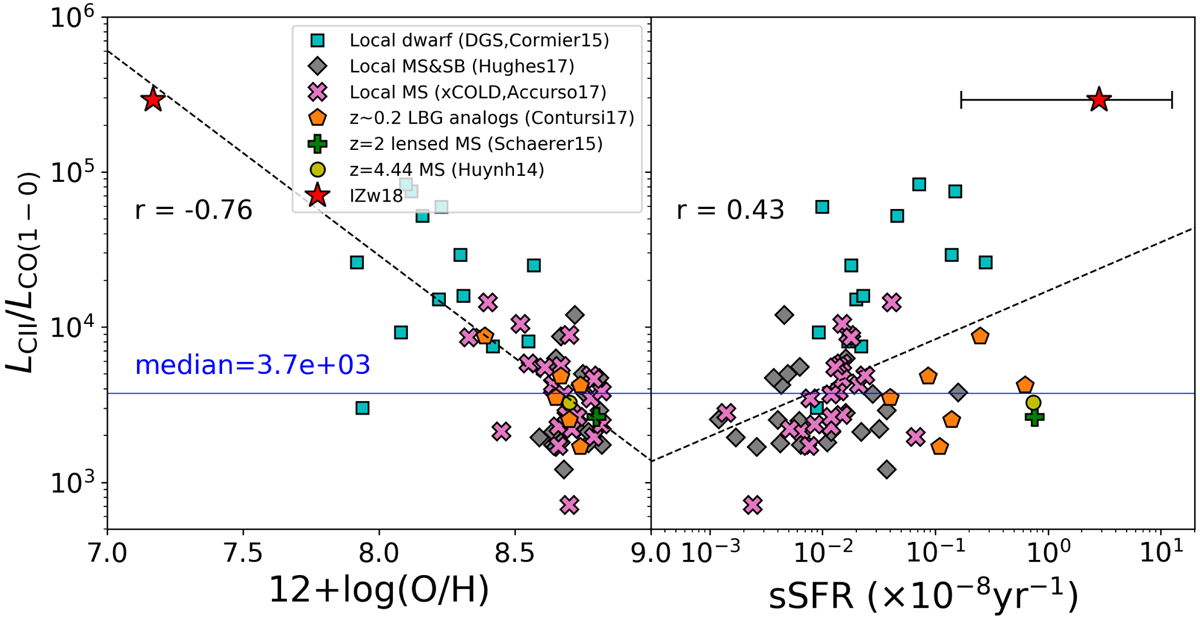
Fig. 5.
Download original image
LC II/LCO(1−0) ratio as a function of the metallicity (left) and specific SFR (right). IZw18 (red star) is compared to the galaxies compiled in Zanella et al. (2018, see references therein). The errorbar reflects the uncertainties of stellar mass and SFR. Pearson’s correlation coefficients for the regression fits are shown in each panel.
Current usage metrics show cumulative count of Article Views (full-text article views including HTML views, PDF and ePub downloads, according to the available data) and Abstracts Views on Vision4Press platform.
Data correspond to usage on the plateform after 2015. The current usage metrics is available 48-96 hours after online publication and is updated daily on week days.
Initial download of the metrics may take a while.