Fig. 1.
Download original image
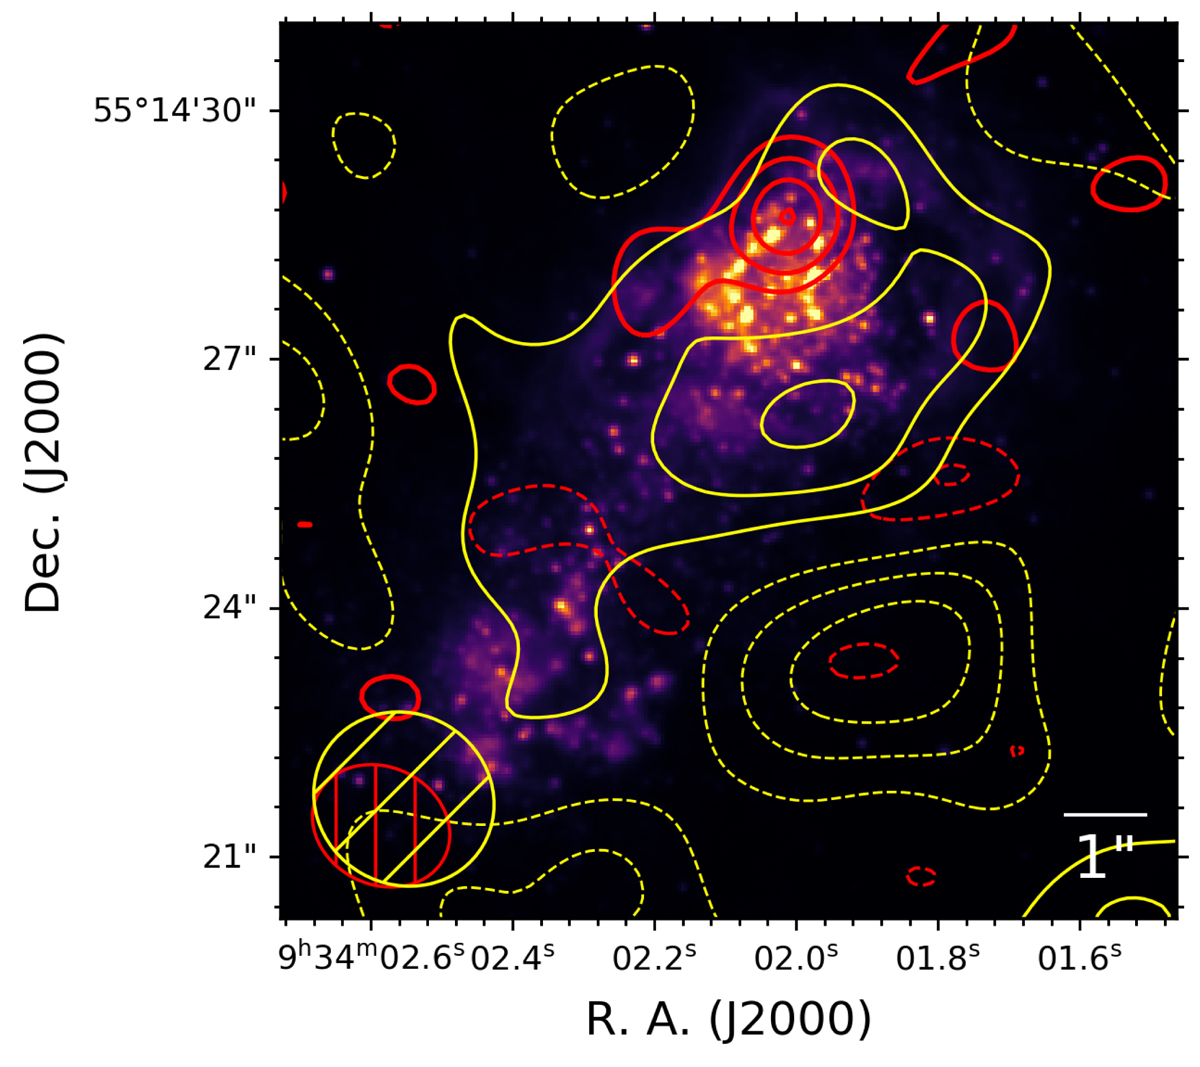
CO J = 2–1 emission and 1.3 mm continuum superimposed on the HST V-band image from Izotov & Thuan (2004, PropID: 9400). The red contours denote the CO J = 2–1 integrated line intensity at the resolution of 1![]() 71 × 1
71 × 1![]() 48, starting from 2σ, in increments of 1σ (3.3 mJy beam−1) significance. The yellow contours denote the continuum detection at 1.3 mm at the resolution of 2
48, starting from 2σ, in increments of 1σ (3.3 mJy beam−1) significance. The yellow contours denote the continuum detection at 1.3 mm at the resolution of 2![]() 21 × 2
21 × 2![]() 06, starting from 1σ, in increments of 1σ (24 μJy beam−1) significance. Dashed contours are negative.
06, starting from 1σ, in increments of 1σ (24 μJy beam−1) significance. Dashed contours are negative.
Current usage metrics show cumulative count of Article Views (full-text article views including HTML views, PDF and ePub downloads, according to the available data) and Abstracts Views on Vision4Press platform.
Data correspond to usage on the plateform after 2015. The current usage metrics is available 48-96 hours after online publication and is updated daily on week days.
Initial download of the metrics may take a while.