Fig. 5
Download original image
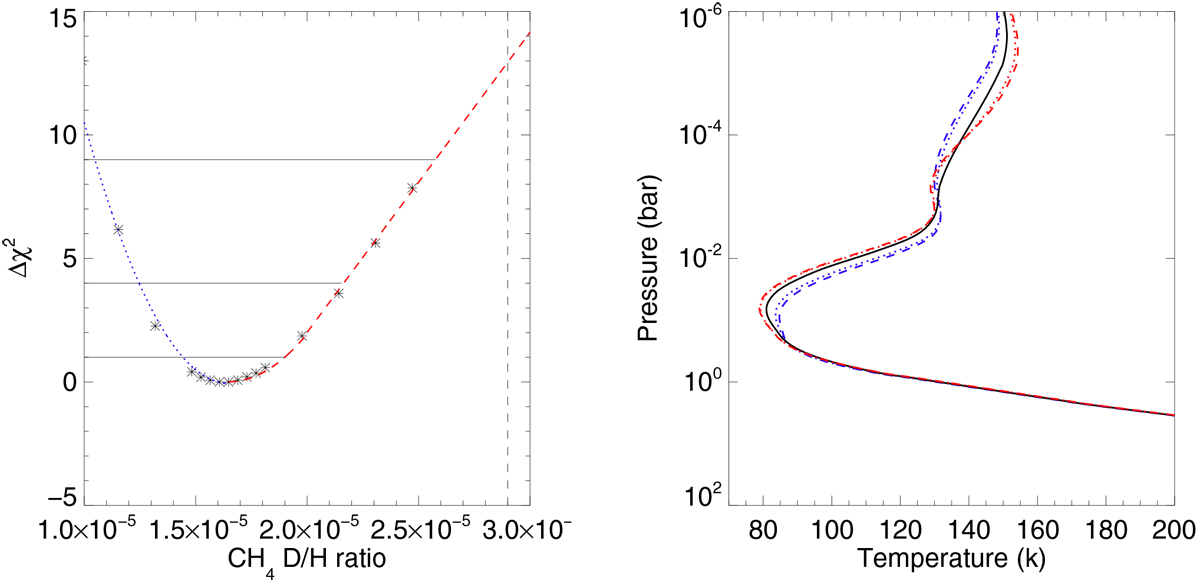
Left: χ2 values (compared to the best fit) of each temperature retrieval for the range of fixed D/H ratios. Measured values are marked by the black asterisks, the blue dotted line marks the quadratic fit to the D/H ratios less than 1.65 × 10⁻⁵ and the dashed red line marks the quadratic fit of the D/H ratios that are greater than 1.65 × 10⁻⁵. The minimum χ2 of 84.487 has been subtracted from all values so that this plot can show Δχ2. The horizontal black lines delineate the Δχ2 of 1, 4 and 9 which correspond to σ1, σ2 and σ3 respectively. The vertical dotted line marks the inferred value of methane D/H 2.9 × 10⁻⁵ converted from the hydrogen proto-solar D/H of Geiss & Gloecker (1998) using a fractionation factor of 1.34, demonstrating that the proto-solar quantity of deuterated methane provides a significantly worse fit using our data and retrieval. Right: temperature profiles associated with CH3 D abundances set to 50% (blue dashed line), 60% (blue dotted line), nominal levels (solid black line), 140% (red dotted line) and 150% (red dashed line). We note that the nominal level is in the centre of these adjusted temperature retrievals, this indicates that the black profile is the best temperature fit for these data.
Current usage metrics show cumulative count of Article Views (full-text article views including HTML views, PDF and ePub downloads, according to the available data) and Abstracts Views on Vision4Press platform.
Data correspond to usage on the plateform after 2015. The current usage metrics is available 48-96 hours after online publication and is updated daily on week days.
Initial download of the metrics may take a while.