Free Access
Fig. 4
Download original image
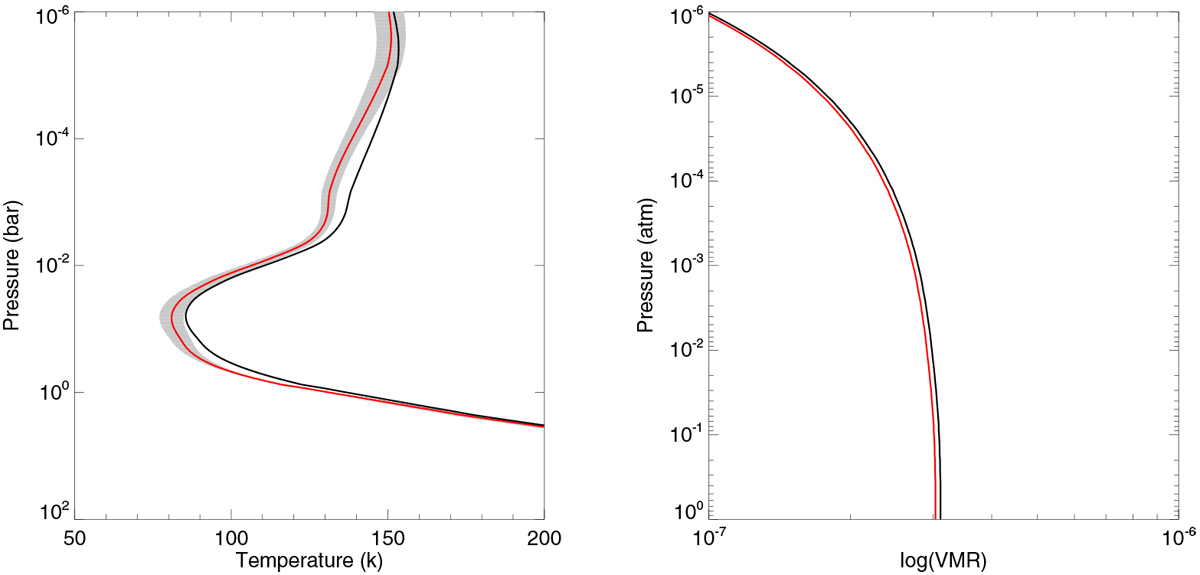
Left: retrieved vertical temperature profile T(p) is shown in red and the shaded grey region is the associated uncertainty, the a priori T(p) estimate is shown in black. Right: retrieved vertical VMR profile of CH3 D is shown in red alongside it’s a priori estimate, which is shown in black.
Current usage metrics show cumulative count of Article Views (full-text article views including HTML views, PDF and ePub downloads, according to the available data) and Abstracts Views on Vision4Press platform.
Data correspond to usage on the plateform after 2015. The current usage metrics is available 48-96 hours after online publication and is updated daily on week days.
Initial download of the metrics may take a while.