Fig. 3
Download original image
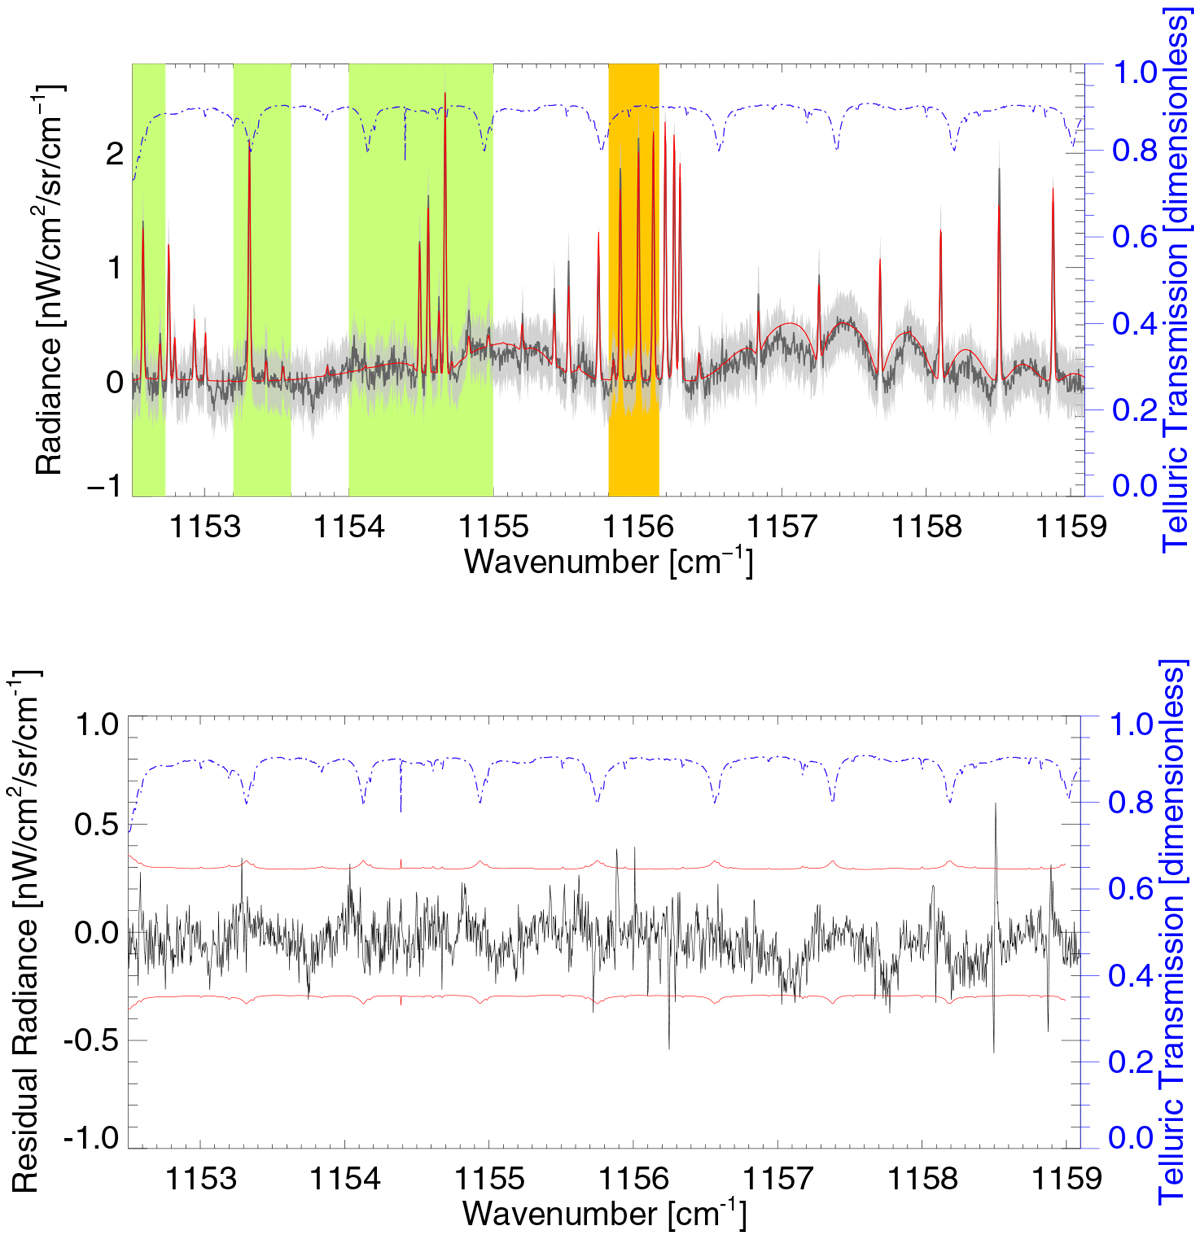
Top: spectral retrieval of the CH4 emission lines and the CH3D emission lines (red line), the spectra from the observation (black solid line), the shaded grey region is the uncertainty range associated with the observed spectra, the telluric absorption (blue dot-dashedline) in this spectral range. The spectral ranges used in the retrieval are highlighted for CH4 (green) and CH3D (orange). Bottom: residual difference between the spectral retrieval and the spectra from the observation (black), the observation uncertainty (red solid line) is shown for each wavelength as well as the telluric absorption (blue dot-dashed line).
Current usage metrics show cumulative count of Article Views (full-text article views including HTML views, PDF and ePub downloads, according to the available data) and Abstracts Views on Vision4Press platform.
Data correspond to usage on the plateform after 2015. The current usage metrics is available 48-96 hours after online publication and is updated daily on week days.
Initial download of the metrics may take a while.