Fig. 2
Download original image
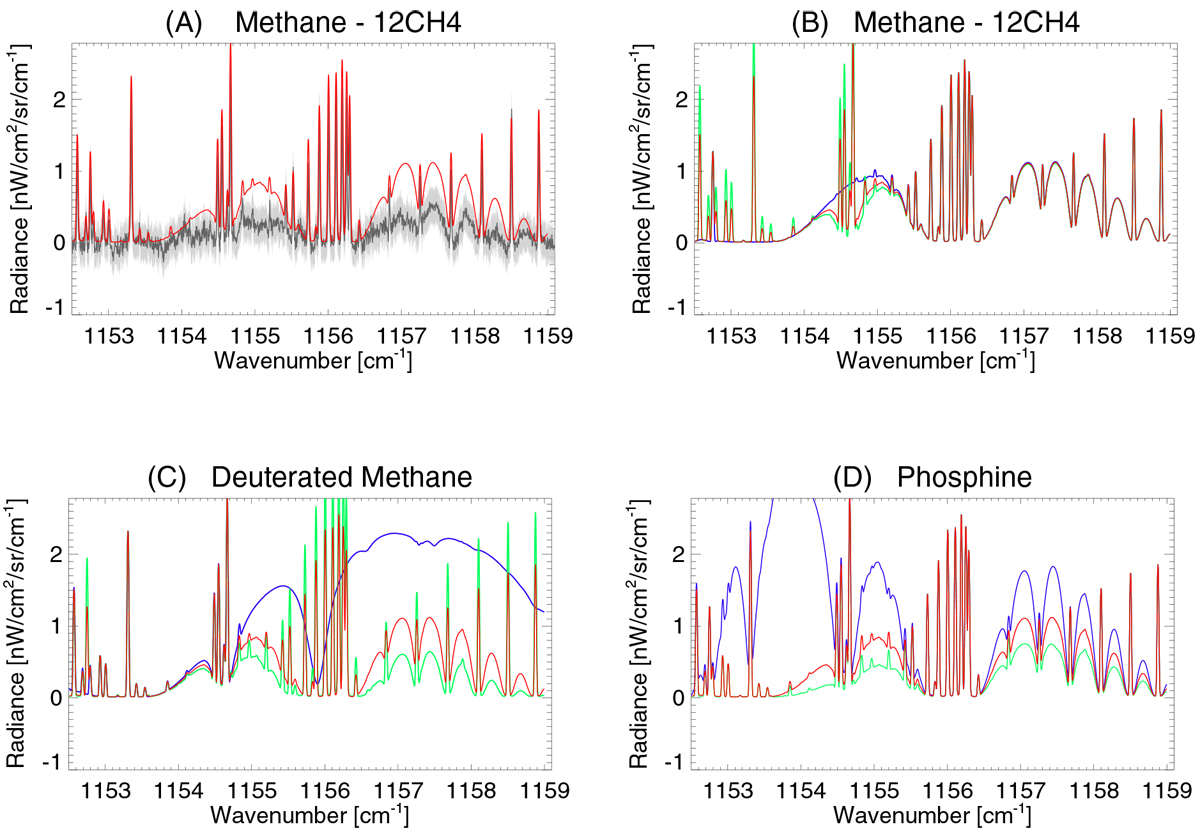
Model spectra showing the influence of varying the abundances of different species. Panel a: model spectrum (red solid line) with nominal levels of three methane isotopologues and phosphine, overlaying the observed spectra shifted down by − 0.21 × 10⁻⁹ W cm−2 str−1 cm−1 (dark grey solid line) and its associated uncertainties (grey shaded region). Panel b: the effect of the CH4 population on this spectral range and similarly for panel c: deuterated methane isotope CH3 D and panel d: tropospheric phosphine (PH3). For each of these three panels b–d, the red profile is the forward model using a nominal level of each species (as per the model of Moses et al. 2000 and Saturn priors from Fletcher et al. 2009), the green line is a forward model with twice the respective nominal level of each species identified in the title, the blue line is the forward model where the volume mixing ratiois set to zero at all altitudes of the identified species.
Current usage metrics show cumulative count of Article Views (full-text article views including HTML views, PDF and ePub downloads, according to the available data) and Abstracts Views on Vision4Press platform.
Data correspond to usage on the plateform after 2015. The current usage metrics is available 48-96 hours after online publication and is updated daily on week days.
Initial download of the metrics may take a while.