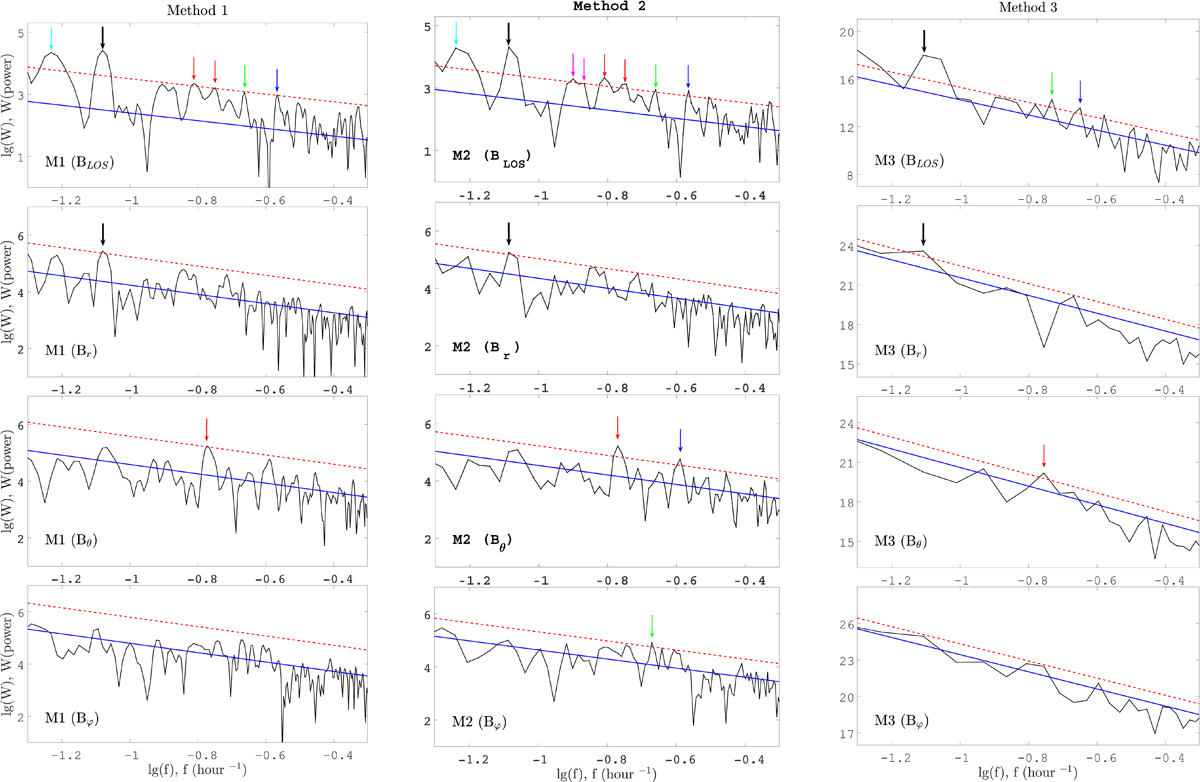
Fig. C.1.
Download original image
Example of power spectra obtained for the area of AR 12381 using methods M1, M2, and M3 for BLOS (the first row of panels from top), Br (the second row), Bθ (the third row), Bφ (the fourth row) data. The solid blue line presents the model line (lgWmodel = mlgf + b) and the #ff0000 dashed line indicates the 95% confidence level. The arrows indicate the significant peaks for each case, accordingly. The colouring of all arrows follows that used in Table B.1. The thick black arrows denote the artefact periods of 12 hours (Liu et al. 2012).
Current usage metrics show cumulative count of Article Views (full-text article views including HTML views, PDF and ePub downloads, according to the available data) and Abstracts Views on Vision4Press platform.
Data correspond to usage on the plateform after 2015. The current usage metrics is available 48-96 hours after online publication and is updated daily on week days.
Initial download of the metrics may take a while.