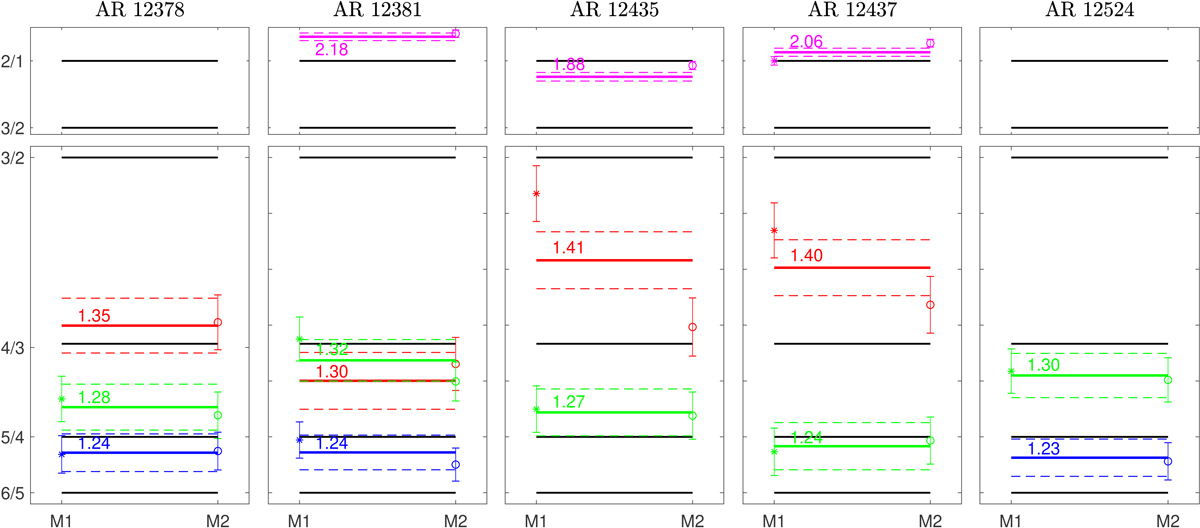
Fig. 3.
Download original image
Ratios of global mean periods (Pi/Pi + 1, i = 1, 2, …) of M1, M2 and the total mean periods shown in the panels of Fig. 2. The formatting of the data points and horizontal lines is the same as in Fig. 2. The colouring in each panel coincides with the period standing in the denominator in each ratio. On the vertical axes, the levels of the period ratios in the reference spectrum are labelled and the corresponding horizontal solid black lines are plotted in all panels.
Current usage metrics show cumulative count of Article Views (full-text article views including HTML views, PDF and ePub downloads, according to the available data) and Abstracts Views on Vision4Press platform.
Data correspond to usage on the plateform after 2015. The current usage metrics is available 48-96 hours after online publication and is updated daily on week days.
Initial download of the metrics may take a while.