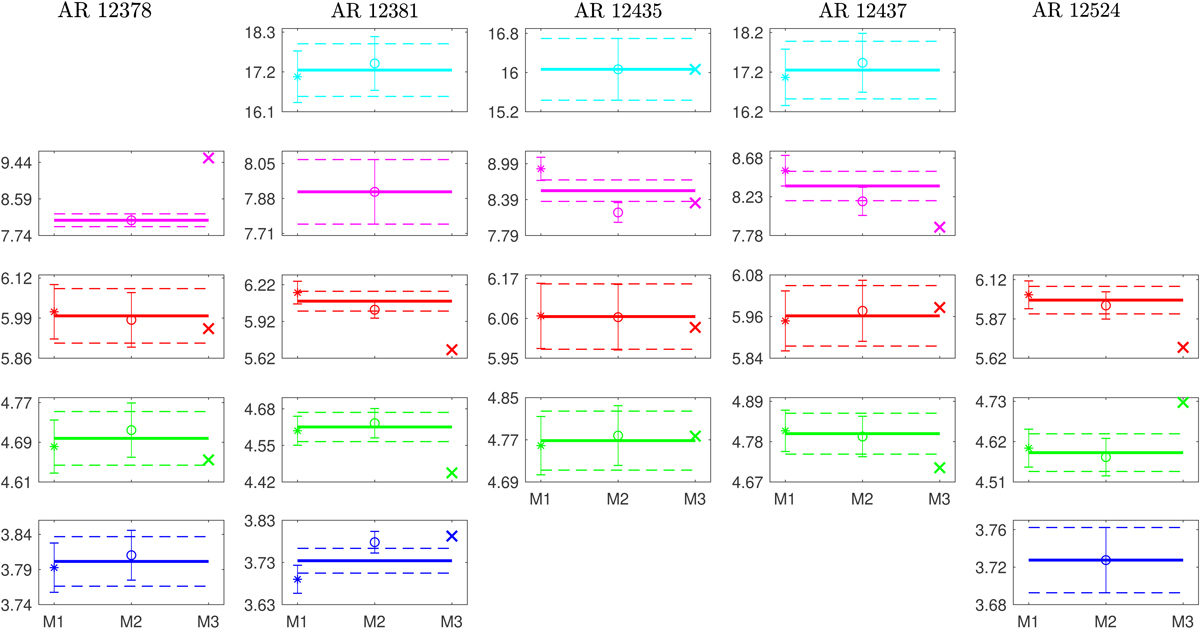
Fig. 2.
Download original image
Characteristic mean oscillation periods (measured in hours) calculated as a global average of those found in different time series separately (for DBLOS, DBr, DBθ, DBφ, and total radial magnetic flux). On the horizontal axes, the M1, M2 and M3 labels, respectively, denote the global mean of the periods obtained by M1 (coloured ‘’ with error bars), M2 (coloured ‘°’ with error bars), and M3 (coloured ‘×’ with error bars). Moreover, we also indicate the total mean periods by taking the average of the mentioned global means of M1 and M2 (i.e. the mean periods obtained by M3 are excluded from the total mean calculation) via the solid-coloured horizontal lines (with the uncertainties indicated by the dashed coloured lines). The colour scheme follows the sequence of quasi-harmonics described in Sect. 3.2 and also corresponds to the colouring used in the tables (see Appendix B).
Current usage metrics show cumulative count of Article Views (full-text article views including HTML views, PDF and ePub downloads, according to the available data) and Abstracts Views on Vision4Press platform.
Data correspond to usage on the plateform after 2015. The current usage metrics is available 48-96 hours after online publication and is updated daily on week days.
Initial download of the metrics may take a while.