Fig. 1.
Download original image
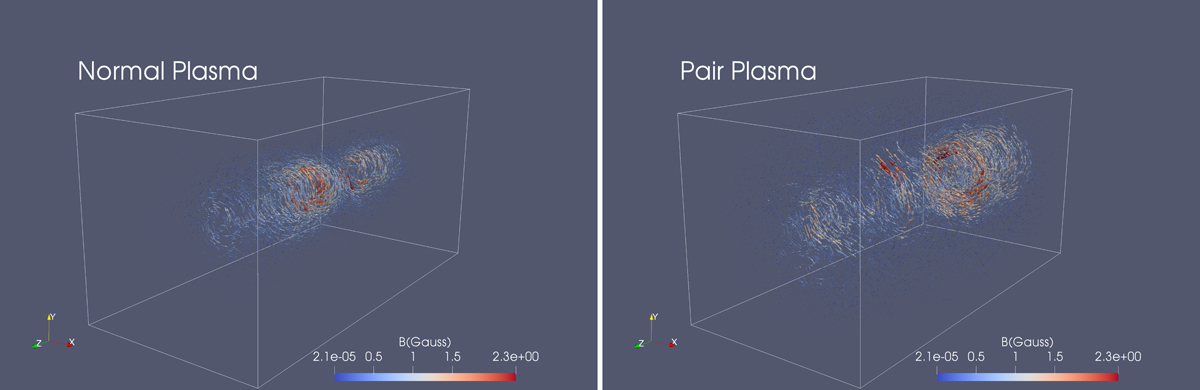
Left panel: 3D visualization of the magnetic field within the normal plasma (e− − p+) PIC jet simulation. Each vector highlights the magnetic field strength within an individual computational cell. Right panel: 3D visualization of the magnetic field within the pair plasma (e− − e+) PIC jet simulation. The same convention (normal plasma on the left and pair plasma on the right) is used in the other figures of this paper.
Current usage metrics show cumulative count of Article Views (full-text article views including HTML views, PDF and ePub downloads, according to the available data) and Abstracts Views on Vision4Press platform.
Data correspond to usage on the plateform after 2015. The current usage metrics is available 48-96 hours after online publication and is updated daily on week days.
Initial download of the metrics may take a while.