Fig. 7.
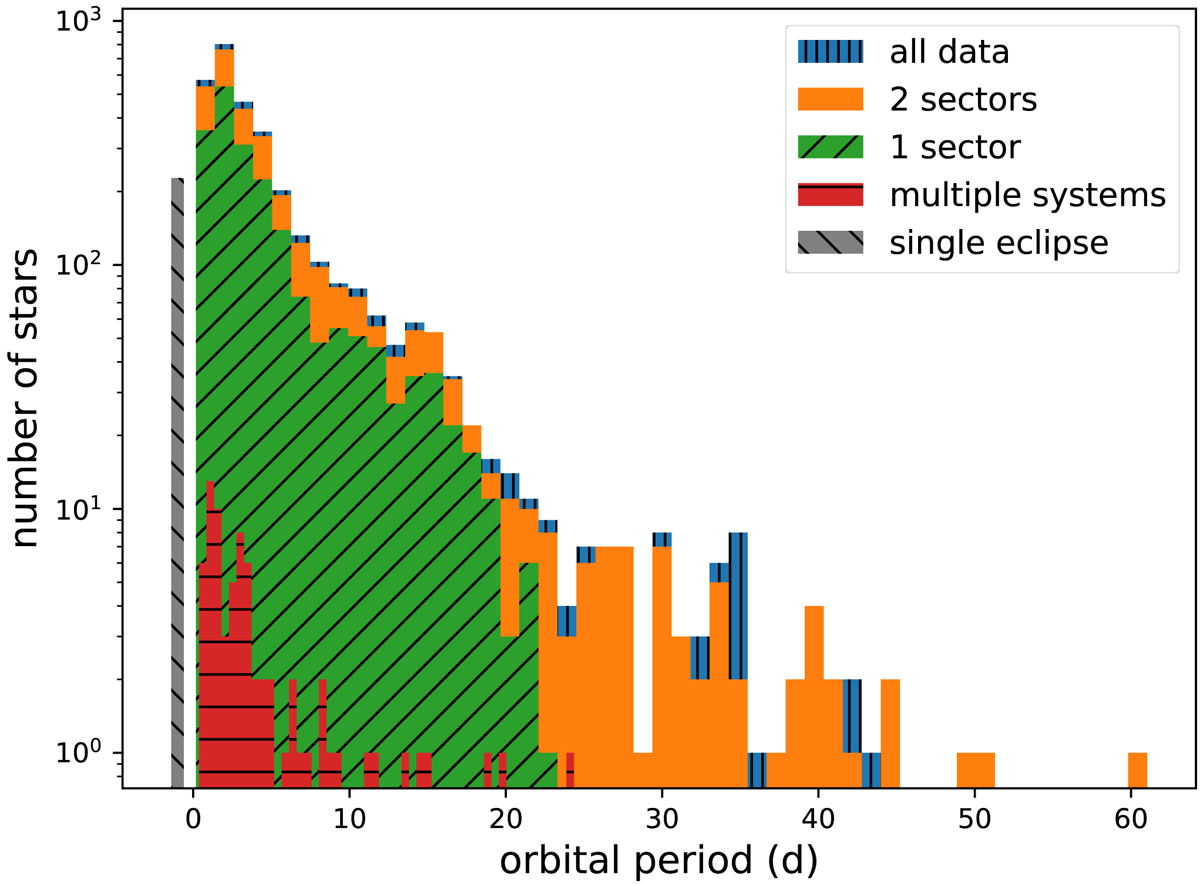
Period distribution below 61 d of all EB candidates after removal of false positives and correction of the periods where necessary. Green and orange bars show the distributions of targets with only one or two sectors available, respectively. The red bars indicate the periods of eclipse signals that are present in addition to the one marked by ECLIPSR, pointing at triple or quadruple systems.
Current usage metrics show cumulative count of Article Views (full-text article views including HTML views, PDF and ePub downloads, according to the available data) and Abstracts Views on Vision4Press platform.
Data correspond to usage on the plateform after 2015. The current usage metrics is available 48-96 hours after online publication and is updated daily on week days.
Initial download of the metrics may take a while.