Fig. C.4.
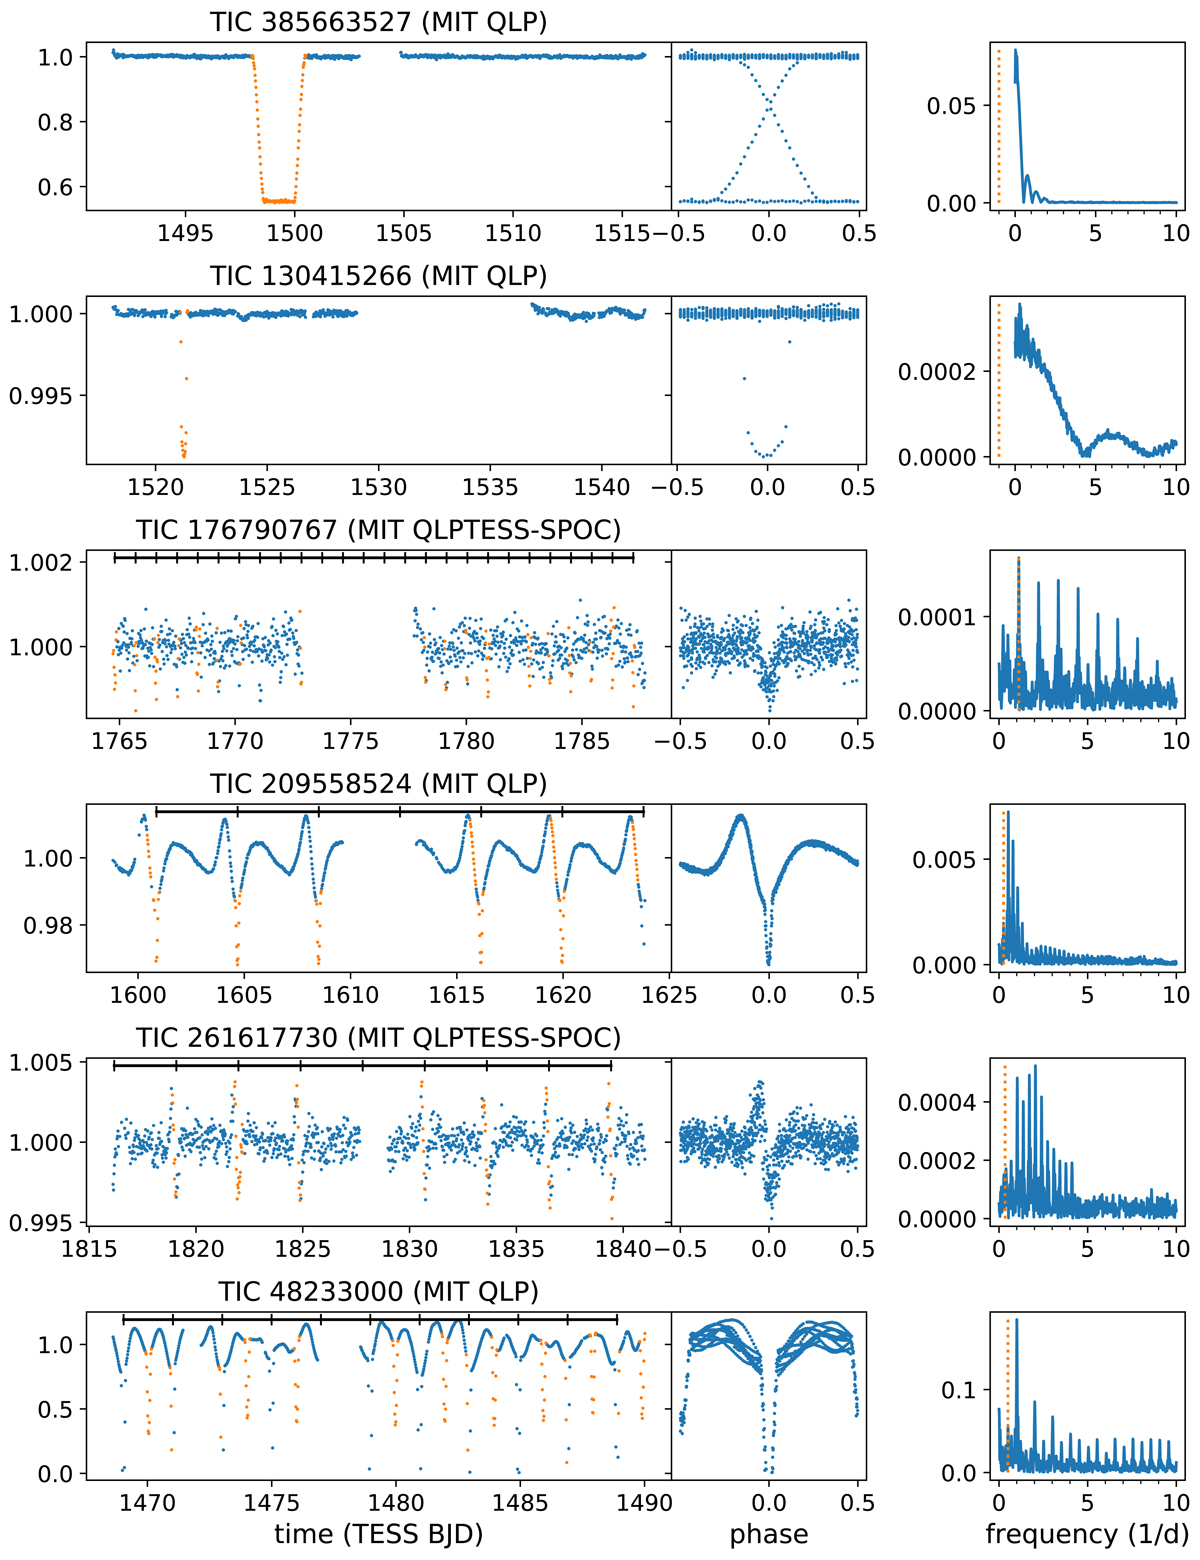
Examples of some notable or interesting targets, including two light curves with a single eclipse and two heartbeat signals. The vertical dotted line in the panels on the right indicates the orbital frequency: a value of minus one means only a single eclipse is present. The bottom row represents a subset of cases where the data reduction resulted in primary eclipses that are cut off at zero, while they never reach their minima.
Current usage metrics show cumulative count of Article Views (full-text article views including HTML views, PDF and ePub downloads, according to the available data) and Abstracts Views on Vision4Press platform.
Data correspond to usage on the plateform after 2015. The current usage metrics is available 48-96 hours after online publication and is updated daily on week days.
Initial download of the metrics may take a while.