Fig. C.1.
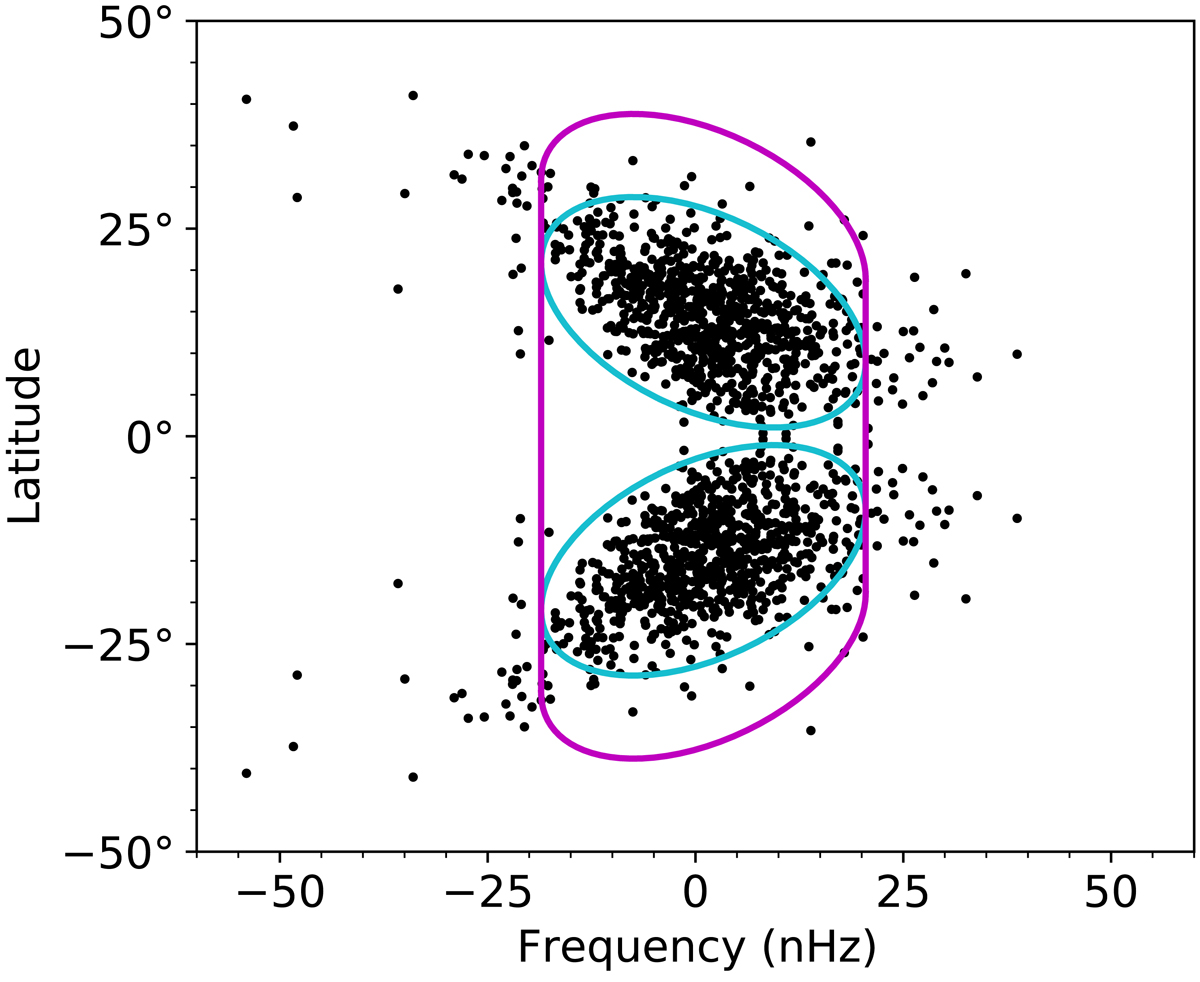
Rotational frequencies of solar active regions versus latitude, measured in the Carrington frame (from May 2010 to December 2016, Kutsenko 2021). The data (black dots) have been symmetrized in latitude. The cyan ellipses contain 90% of the active regions. The ellipses are extended to higher latitudes by 10° and down to the equator to include flows around active regions. The resulting region in frequency–latitude space is given by the purple contour, which we denote via the equation ω = ΩAR(θ)−ΩCarr. We note that the HMI data used in the main text cover a longer observation period (from May 2010 to September 2020); however, the purple contour is not significantly affected by the very few active regions from the nearly quiet period 2017–2020 (about 5% of all cycle 24 active regions).
Current usage metrics show cumulative count of Article Views (full-text article views including HTML views, PDF and ePub downloads, according to the available data) and Abstracts Views on Vision4Press platform.
Data correspond to usage on the plateform after 2015. The current usage metrics is available 48-96 hours after online publication and is updated daily on week days.
Initial download of the metrics may take a while.