Fig. 2.
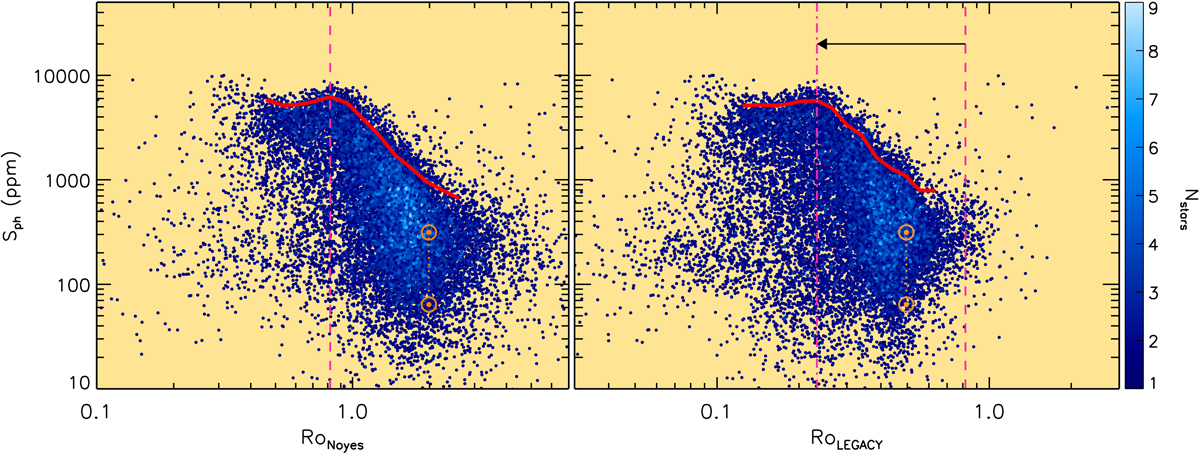
Stellar activity index Sph as a function of the Rossby number. Left panel: Rossby number evaluated with the semi-empirical relation by Noyes et al. (1984). Right panel: details are similar to the left panel, but using the Rossby number evaluated with the new convective turnover time from Eq. (9). The thick red lines represent the maximum Sph of the 95 percentile of each chunk in Rossby number, evaluated in a range centered around the kink. Sun symbols mark the position of the Sun between the minimum and maximum of activity (RoNoyes, ⊙ = 1.989, RoLEGACY, ⊙ = 0.496). The position of the kink is marked by the vertical dashed and dot-dashed lines, for the left and right panel, respectively. The left-pointing arrow shows how the position of the kink shifts when switching from τc, N84 to τc, LEGACY. The density of stars is indicated by the blue color scale.
Current usage metrics show cumulative count of Article Views (full-text article views including HTML views, PDF and ePub downloads, according to the available data) and Abstracts Views on Vision4Press platform.
Data correspond to usage on the plateform after 2015. The current usage metrics is available 48-96 hours after online publication and is updated daily on week days.
Initial download of the metrics may take a while.