Fig. C.1
Download original image
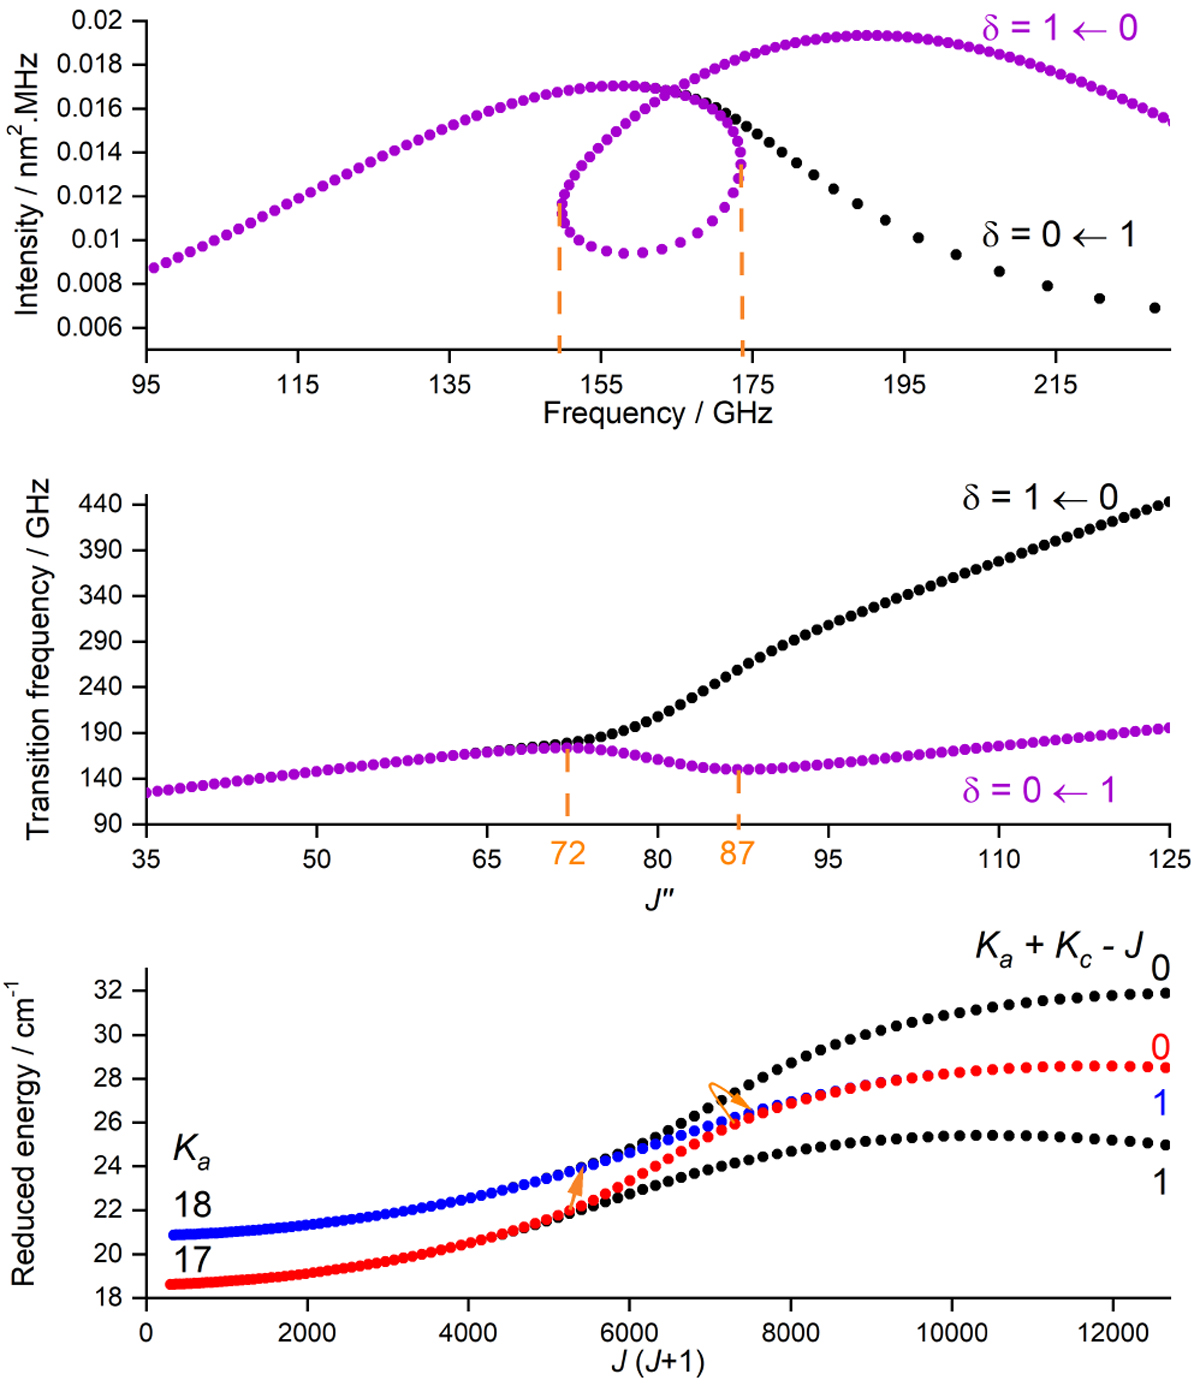
Illustration of the loop observed in the rR branches of m-DCB, with δ = Δ(Ka + Kc − J) = 0 ← 1; case of the rR(17) branch. For the two series of transitions, the two band heads are highlighted in orange. (top trace) Intensity of the transitions as a function of the frequency; (middle trace) transition frequency as a function of J″; and (bottom trace) reduced energy of the involved energy levels as a function of J(J + 1). Reduced energies and intensities are from an SPCAT prediction file obtained using the final set of constants (Table 1 in the main text); reduced energies were calculated using the following formula: Ereduced = E − hc × 1∕2(B + C)J(J + 1), where E is in wavenumber and B and C are in megahertz.
Current usage metrics show cumulative count of Article Views (full-text article views including HTML views, PDF and ePub downloads, according to the available data) and Abstracts Views on Vision4Press platform.
Data correspond to usage on the plateform after 2015. The current usage metrics is available 48-96 hours after online publication and is updated daily on week days.
Initial download of the metrics may take a while.