Fig. 4
Download original image
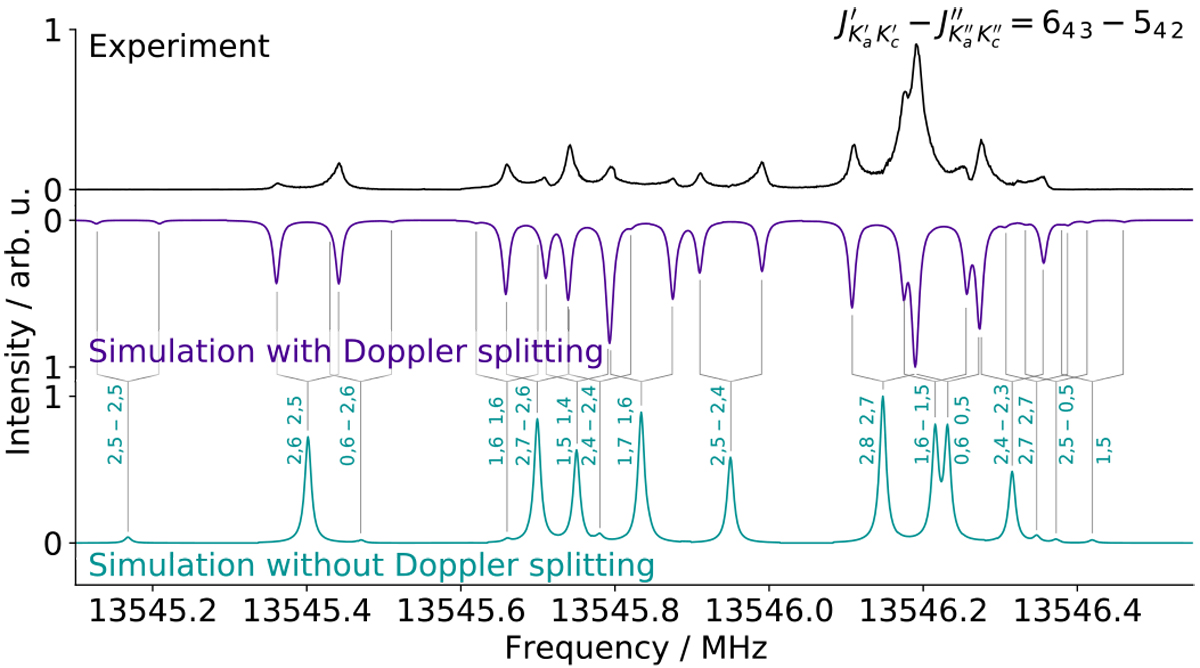
Example of a rotational transition of o-DCB, recorded in the centimetre-wave domain using FTMW spectroscopy (black trace), showing resolved hyperfine lines, and comparison with simulations taking (in purple) and not taking (in bluish green) the Doppler splitting of each components into account (see text). Grey lines indicate the hyperfine components. Simulations were performed using the PGOPHER software and the best set of spectroscopic constants (Table 1). Quantum numbers associated with the assigned transitions are written in form I′, F′ − I″, F″.
Current usage metrics show cumulative count of Article Views (full-text article views including HTML views, PDF and ePub downloads, according to the available data) and Abstracts Views on Vision4Press platform.
Data correspond to usage on the plateform after 2015. The current usage metrics is available 48-96 hours after online publication and is updated daily on week days.
Initial download of the metrics may take a while.