Fig. 3
Download original image
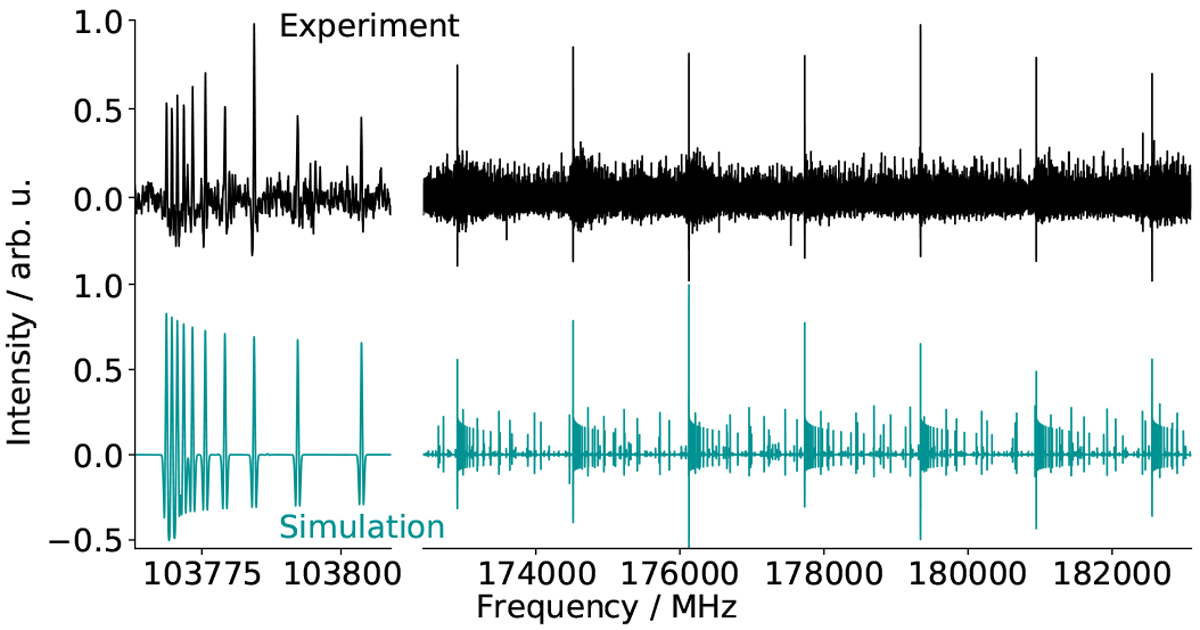
Portions of the experimental millimetre-wave survey o-DCB (upper plots in black) and comparison with a simulation of the rotational spectrum of the species using the final best-fit constants (lower plots in bluish green, see Table 1). The PGOPHER software was used to simulate the spectrum at 300 K, the second derivative of the obtained traces was subsequently calculated to allow for a better comparison with the experimental spectrum. Additional lines present on the experimental spectrum, but not reproduced by the simulation, most likely arise from vibrational satellites (i.e. pure rotational transitions within vibrationally excited states); however, because of their lower relative intensity, no attempt was made to assign them in this work.
Current usage metrics show cumulative count of Article Views (full-text article views including HTML views, PDF and ePub downloads, according to the available data) and Abstracts Views on Vision4Press platform.
Data correspond to usage on the plateform after 2015. The current usage metrics is available 48-96 hours after online publication and is updated daily on week days.
Initial download of the metrics may take a while.