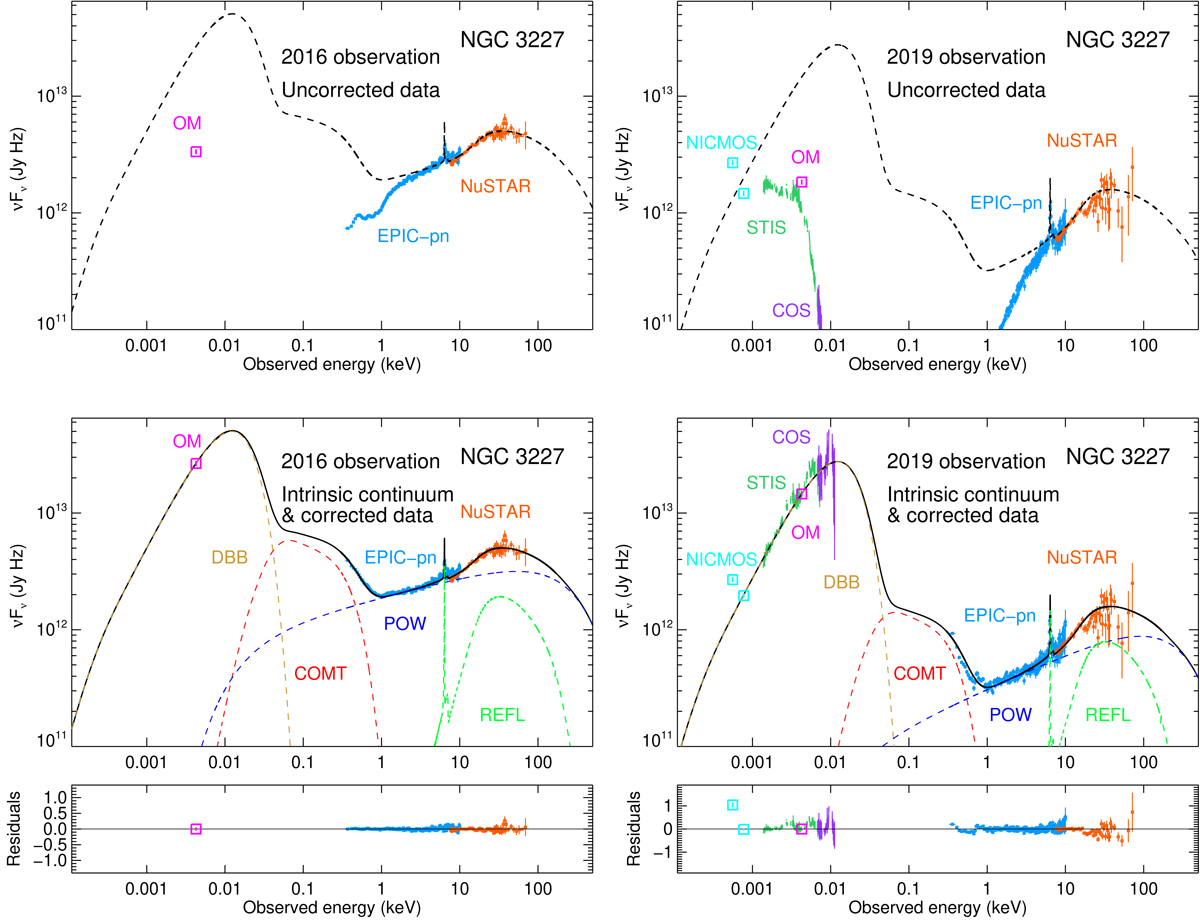
Fig. 7.
Download original image
SED continuum model of NGC 3227 from NIR to hard X-rays, derived from fitting the XMM-Newton, NuSTAR and HST data. The data are from the 2016 unobscured (left panels) and 2019 obscured (right panels) observations. The data in the top panels include the effects of reddening and X-ray absorption, while those in the middle panels are corrected for these effects, revealing the underlying continuum. The best-fit continuum model is shown in dashed black line in the top panels and solid black line the middle panels for comparison with the data. Residuals of the fit, defined as (data−model)/model, are displayed in the bottom panels. The archival HST NICMOS data at NIR are not included in our spectral fitting, but rather are over-plotted for comparison with our SED model as described in Sect. 3.1. The displayed spectra have been binned for clarity of presentation. The displayed OM data are taken with the UVW1 filter. The contribution of individual continuum components is displayed in the middle panels: a disk blackbody component (dbb, dashed brown line), a warm Comptonisation component for the ‘soft X-ray excess’ (comt, dashed red line), a power-law continuum for the hard X-rays (pow, dashed blue line), an X-ray reflection component (refl, dashed green line).
Current usage metrics show cumulative count of Article Views (full-text article views including HTML views, PDF and ePub downloads, according to the available data) and Abstracts Views on Vision4Press platform.
Data correspond to usage on the plateform after 2015. The current usage metrics is available 48-96 hours after online publication and is updated daily on week days.
Initial download of the metrics may take a while.