Fig. 6.
Download original image
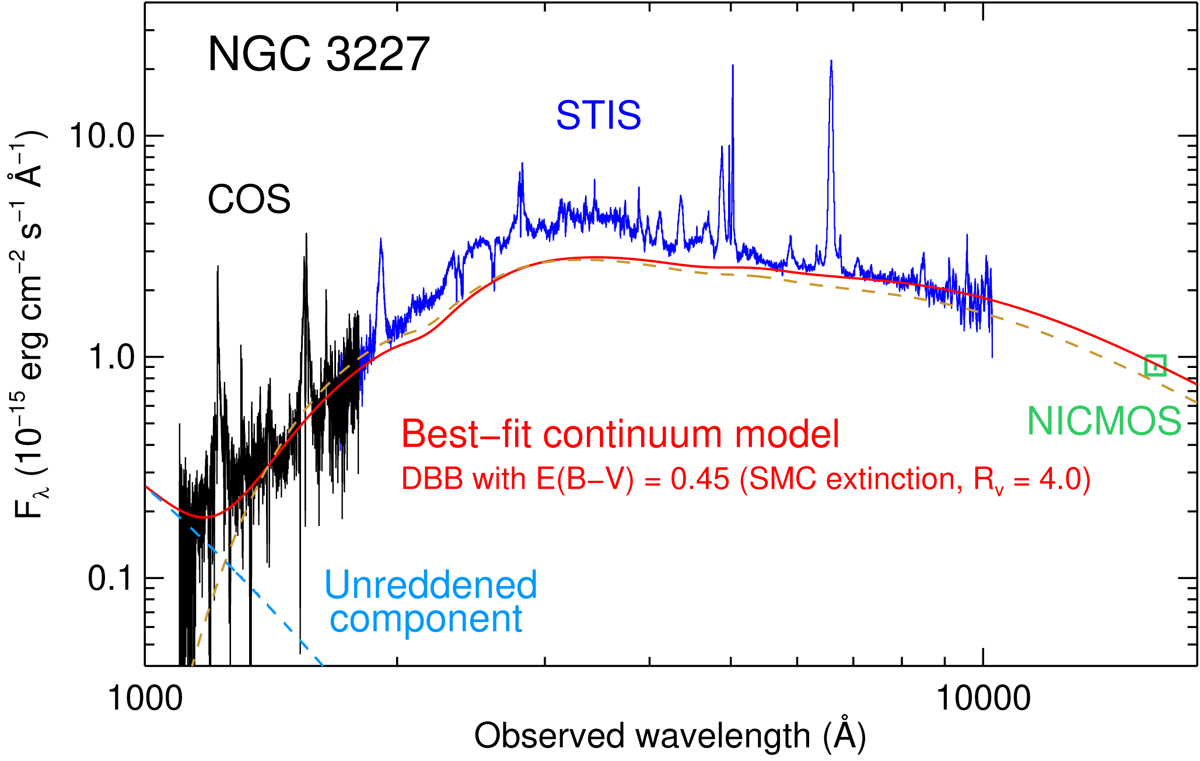
NIR-optical-UV spectrum of NGC 3227 taken with HST COS and STIS. The continuum flux in the NIR from HST/NICMOS is also plotted. The best-fit continuum model, consisting of a reddened dbb and an additional unreddened component at shortest wavelengths (dashed blue line) is shown as a solid red line. For comparison the best-fit model without an unreddened component is also plotted (dashed brown line), which does not fit the data well at shortest wavelengths. The broad feature above the continuum at about 2000–4000 Å is the blended Fe II and Balmer emission.
Current usage metrics show cumulative count of Article Views (full-text article views including HTML views, PDF and ePub downloads, according to the available data) and Abstracts Views on Vision4Press platform.
Data correspond to usage on the plateform after 2015. The current usage metrics is available 48-96 hours after online publication and is updated daily on week days.
Initial download of the metrics may take a while.