Fig. 8
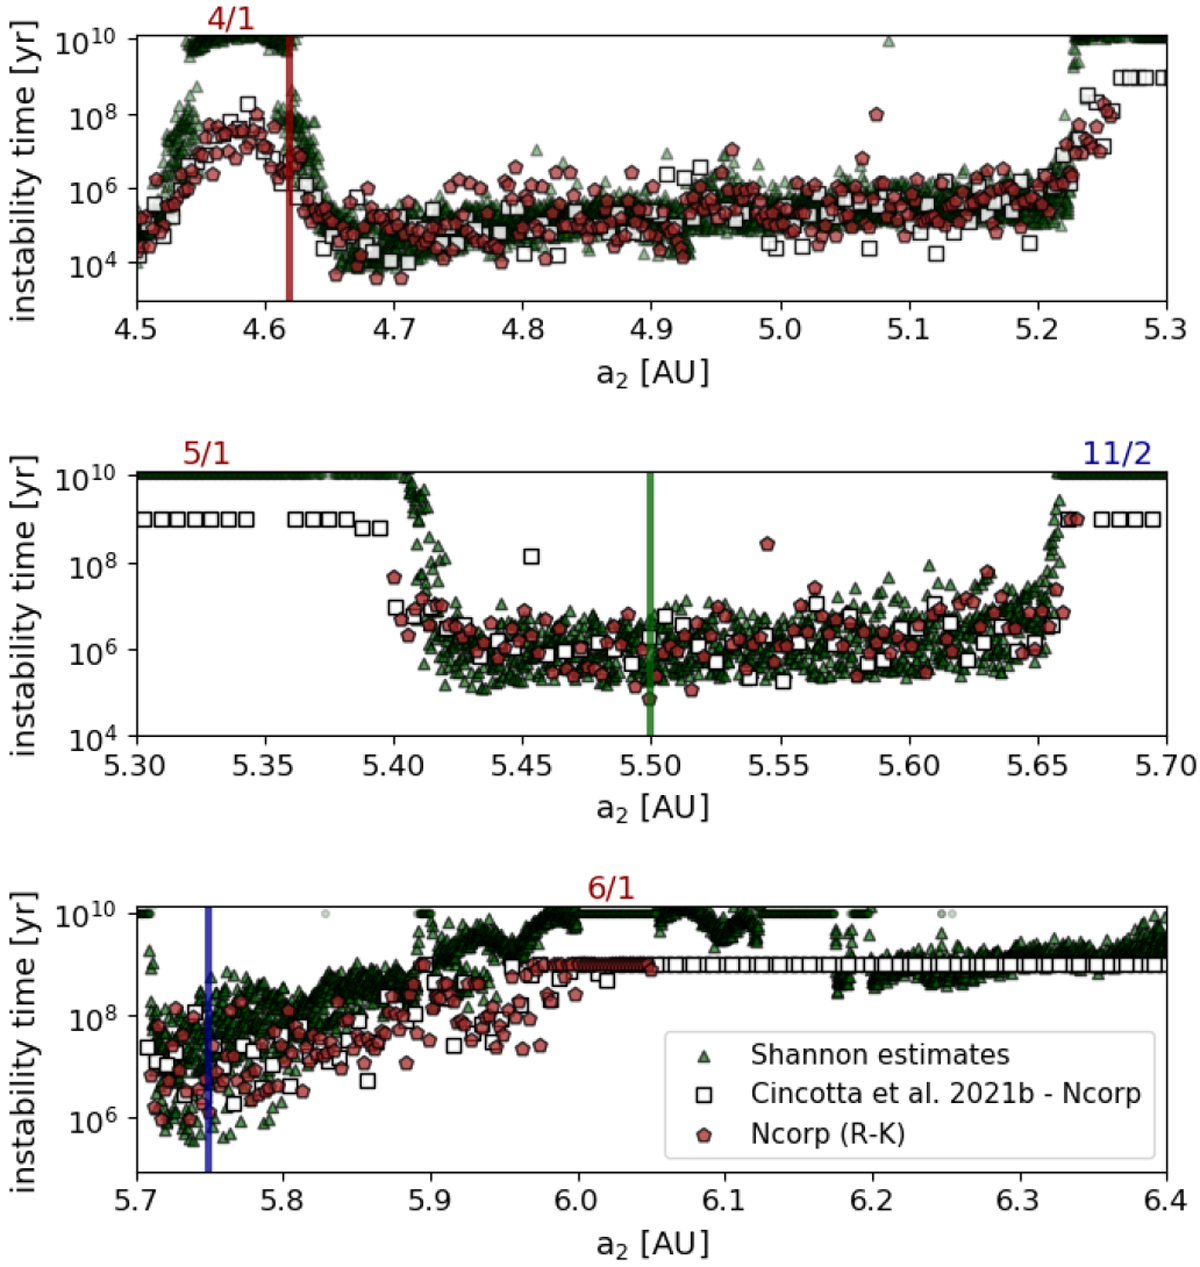
Three sections of the instability time distributions obtained from the solutions over a segment of ICs in a2, previously presented in Fig. 7. We have added new direct integrations performed with a R-K integrator, plotted here with red markers. The thin colored lines in each panel highlight the nominal position of the individual ICs (A1) in blue, (A2) in red, and (A3) in green, following the color code applied in Fig. 4.
Current usage metrics show cumulative count of Article Views (full-text article views including HTML views, PDF and ePub downloads, according to the available data) and Abstracts Views on Vision4Press platform.
Data correspond to usage on the plateform after 2015. The current usage metrics is available 48-96 hours after online publication and is updated daily on week days.
Initial download of the metrics may take a while.