Fig. 7
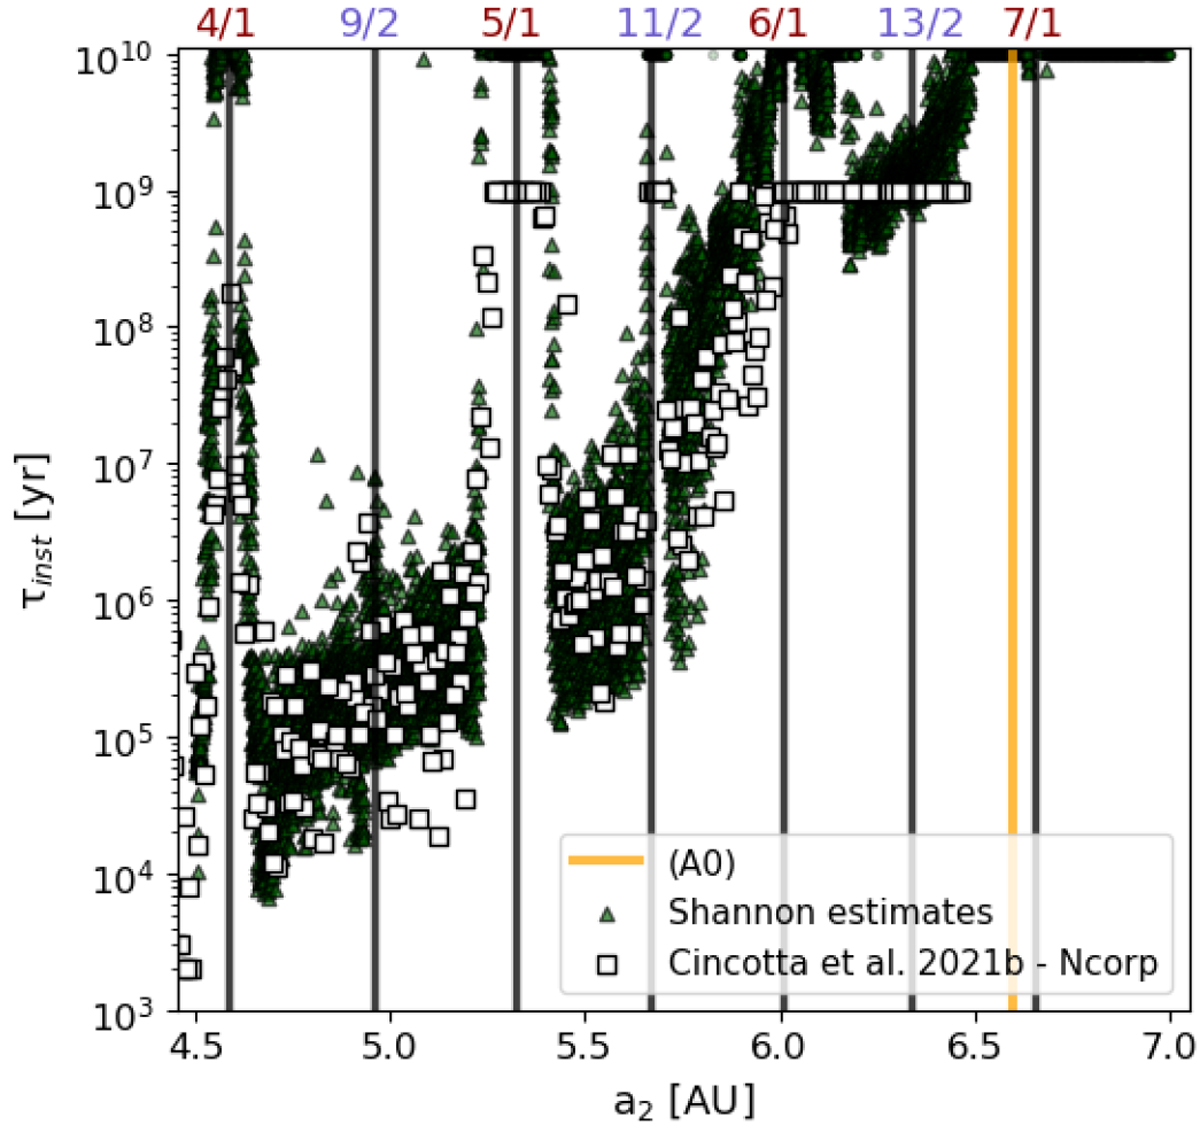
Distribution of the respective values of τinst-estimates for a set of 104 ICs in the range 4.5AU ≤ a2 ≤ 7.0AU. Straight black lines highlight the exact positions of the lowest-order MMRs identifiable, and the yellow one indicates the nominal position of the real system (near the 7/1 MMR). The white squares represent the disruption times tdis as obtained by Cincotta et al. (2021b) from direct integrations of 374 ICs on almost the same segment (there, the grid size in a2 was ~ 6.5 × 10⁻³ AU).
Current usage metrics show cumulative count of Article Views (full-text article views including HTML views, PDF and ePub downloads, according to the available data) and Abstracts Views on Vision4Press platform.
Data correspond to usage on the plateform after 2015. The current usage metrics is available 48-96 hours after online publication and is updated daily on week days.
Initial download of the metrics may take a while.