Fig. 5
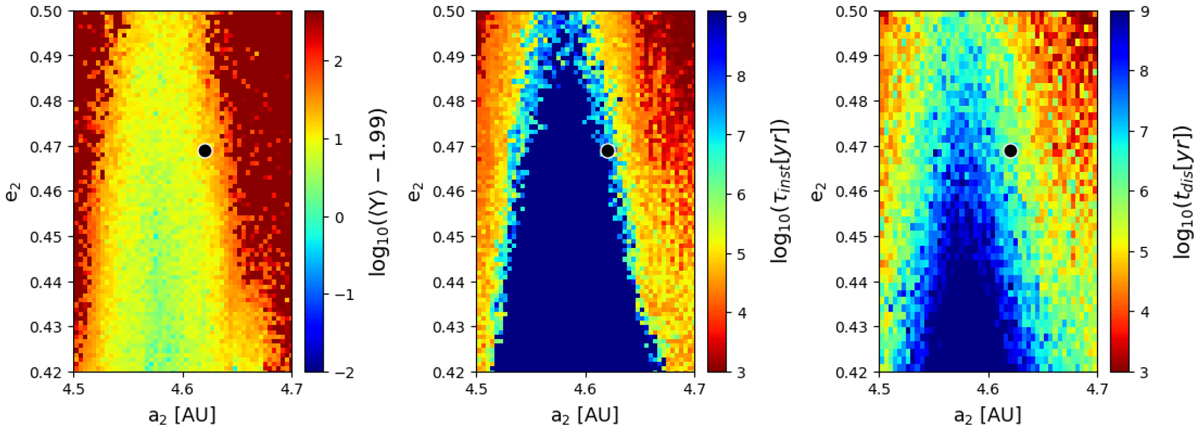
Dynamical maps constructed over the (a2, e2) space of ICs of HD 181433. Left-hand and middle panels: a 100 × 100-mesh of ICs was integrated in T = 0.1 Myr, with grid sizes being 0.004 AU in a2 and 0.001 in e2. Right-handpanel: disruption times obtained from N-body simulation spanned to 1 Gyr, over a grid of 50 × 50 ICs. The black dot indicates the nominal position of (A2) in each plane.
Current usage metrics show cumulative count of Article Views (full-text article views including HTML views, PDF and ePub downloads, according to the available data) and Abstracts Views on Vision4Press platform.
Data correspond to usage on the plateform after 2015. The current usage metrics is available 48-96 hours after online publication and is updated daily on week days.
Initial download of the metrics may take a while.