Fig. 3
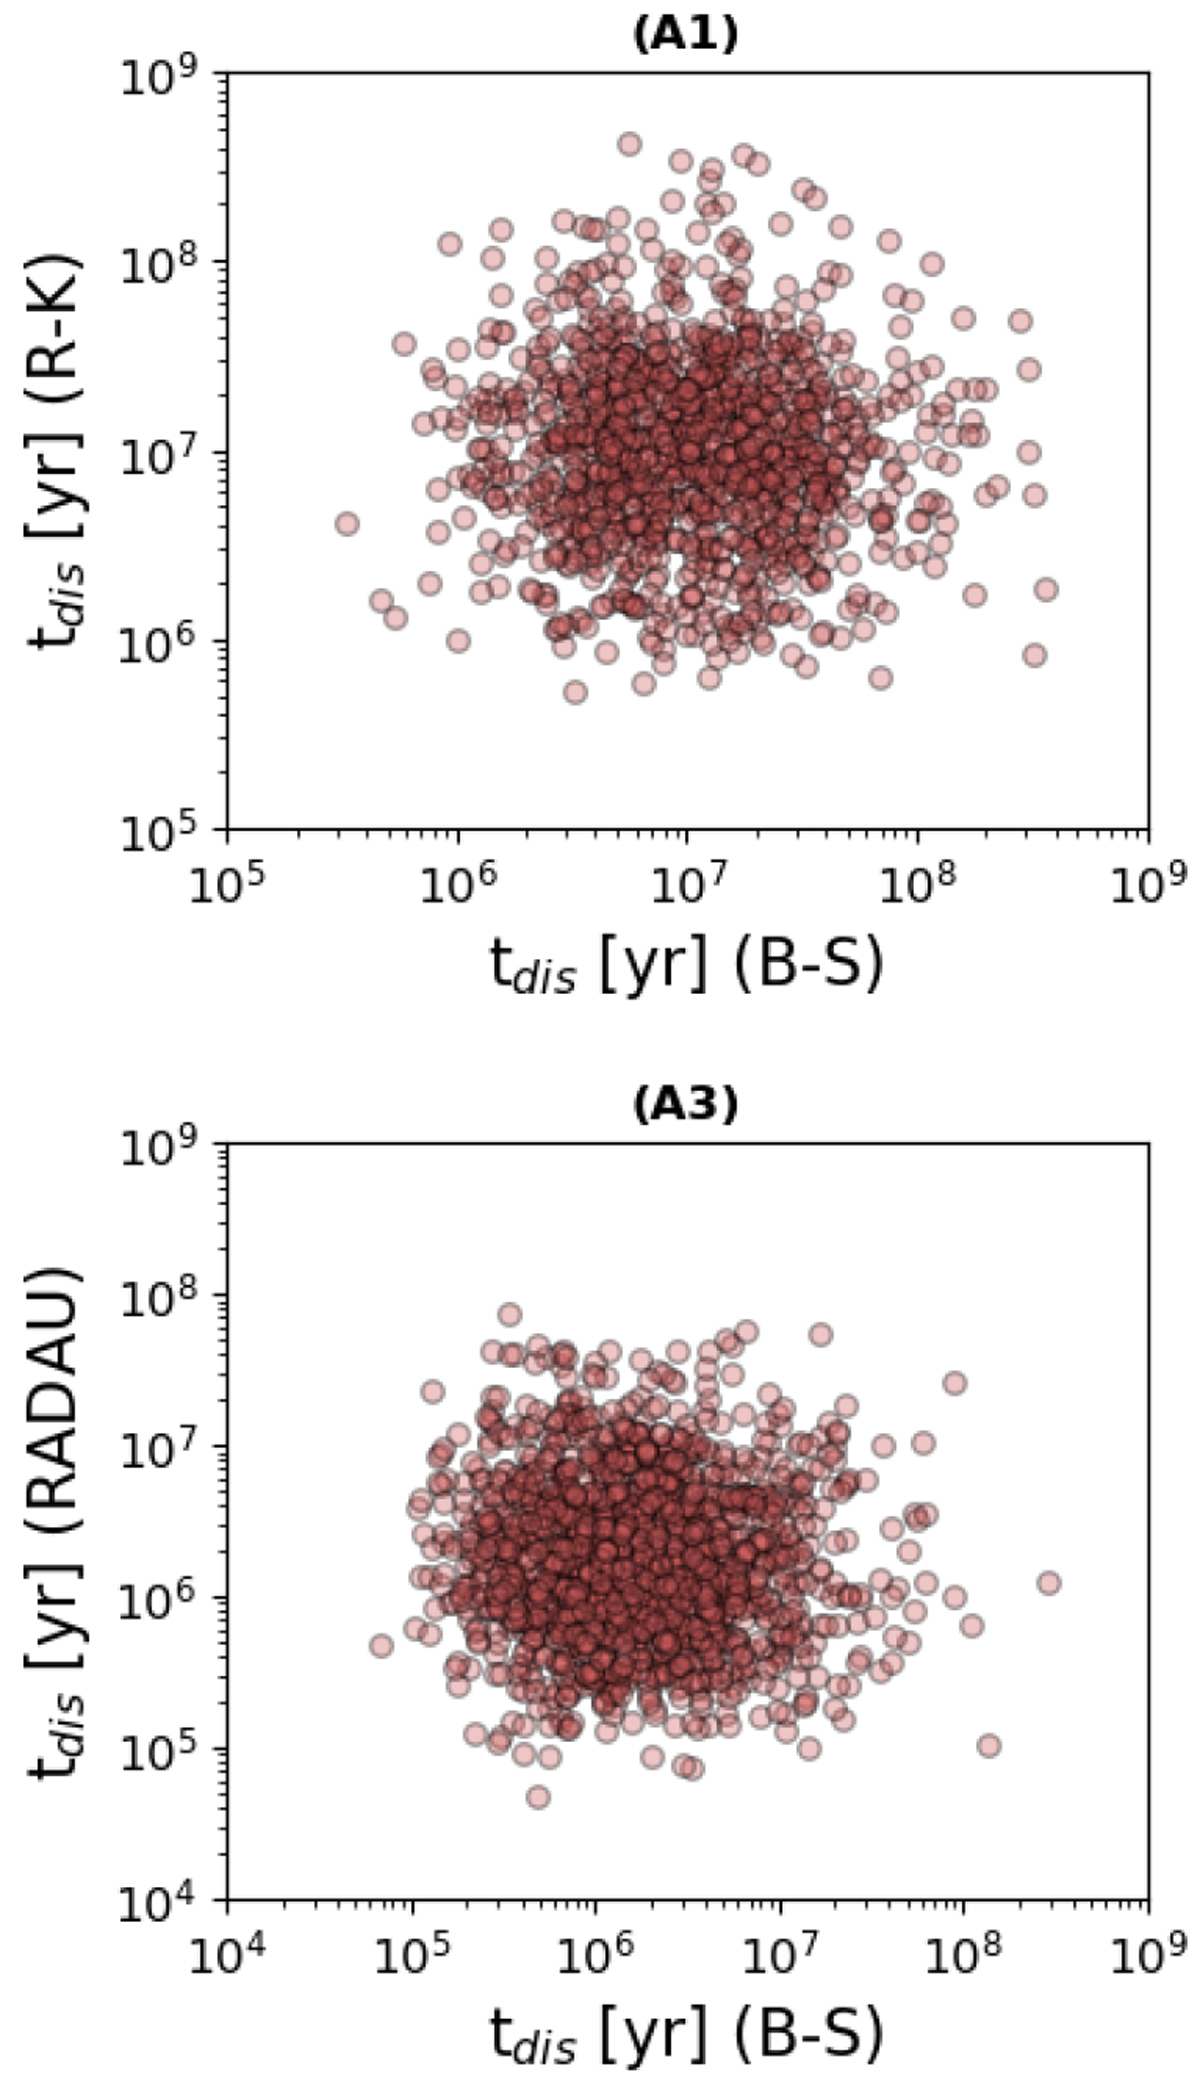
Top: correlation diagram between the disruption times tdis obtained from direct integrations of ICs in the close neighborhood of (A1), applying a Bulirsch-Stoer (B-S) and a Runge-Kutta (R-K) integrator. Bottom: analogous result for (A3), but comparing B-S and Radau15 integrators. The same numerical precision was set for all the simulations.
Current usage metrics show cumulative count of Article Views (full-text article views including HTML views, PDF and ePub downloads, according to the available data) and Abstracts Views on Vision4Press platform.
Data correspond to usage on the plateform after 2015. The current usage metrics is available 48-96 hours after online publication and is updated daily on week days.
Initial download of the metrics may take a while.