Fig. 2
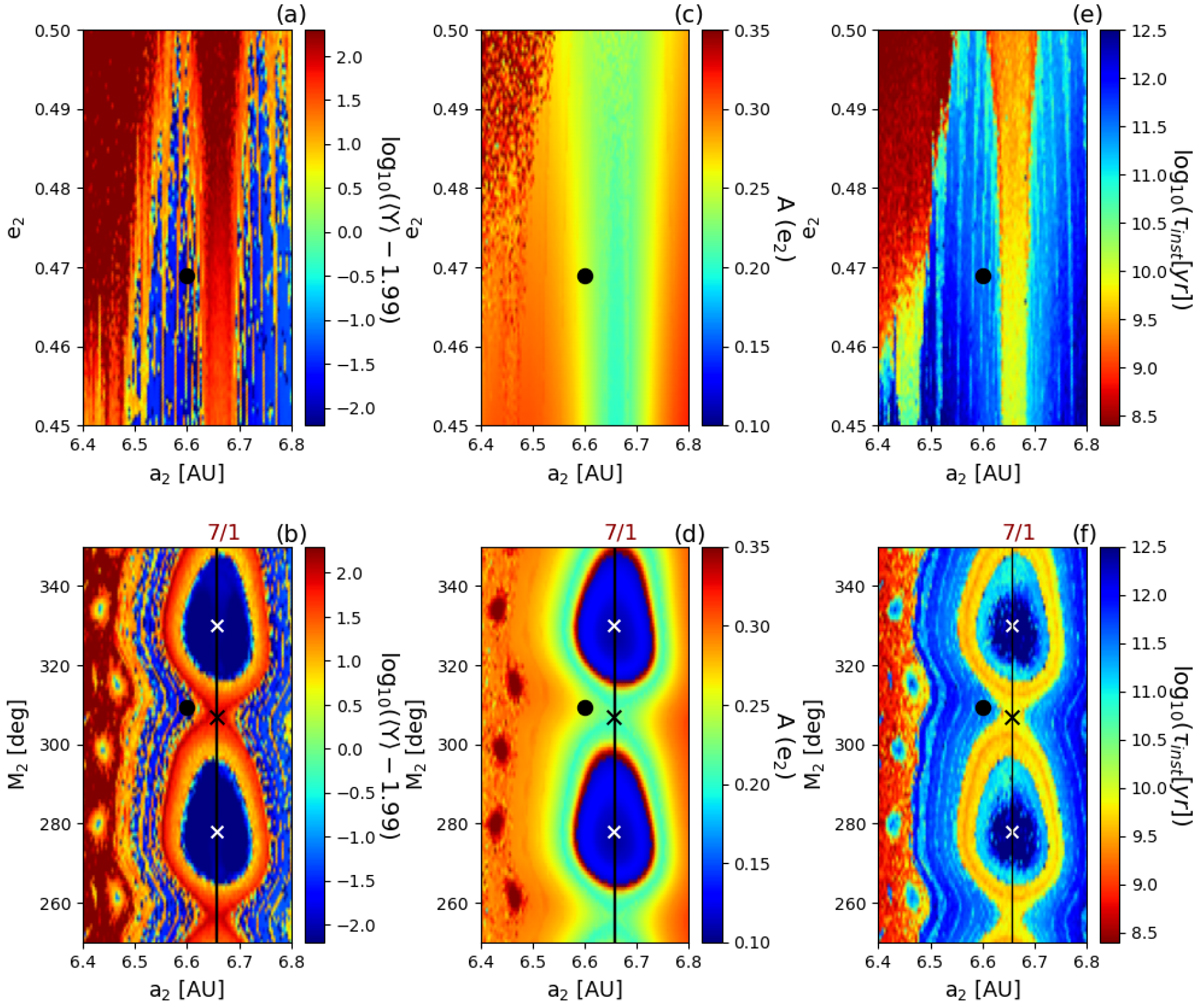
Dynamical maps for the HD 181433 system, constructed over the (a2, e2) (top) and (a2, M2) (bottom) planes of ICs and obtained from the numerical solutions of a mesh of 100 × 100 ICs. The grid sizes are 0.004 AU in a2, 0.0005 in e2 and 1 deg inM2. (a–b) MEGNO-maps showing the rescaled value ⟨Y′⟩ = ⟨Y ⟩− 1.99. (c–d) e2-maps of the maximum amplitude of variation of e2 within T = 1 Myr. (e–f) τinst-maps obtained from DS-estimates. The (a2, M2)-maps show the chain of resonant islands generated by the 7/1 MMR, inside which a stable motion is expected. In all the bottom panels, the “X”-symbols mark the elliptic (white) and hyperbolic (black) solutions. The black dot indicates (A0). In maps a through d, integrations were carried out to 1 Myr; in the case of e and f the time-span was set ten times lower.
Current usage metrics show cumulative count of Article Views (full-text article views including HTML views, PDF and ePub downloads, according to the available data) and Abstracts Views on Vision4Press platform.
Data correspond to usage on the plateform after 2015. The current usage metrics is available 48-96 hours after online publication and is updated daily on week days.
Initial download of the metrics may take a while.