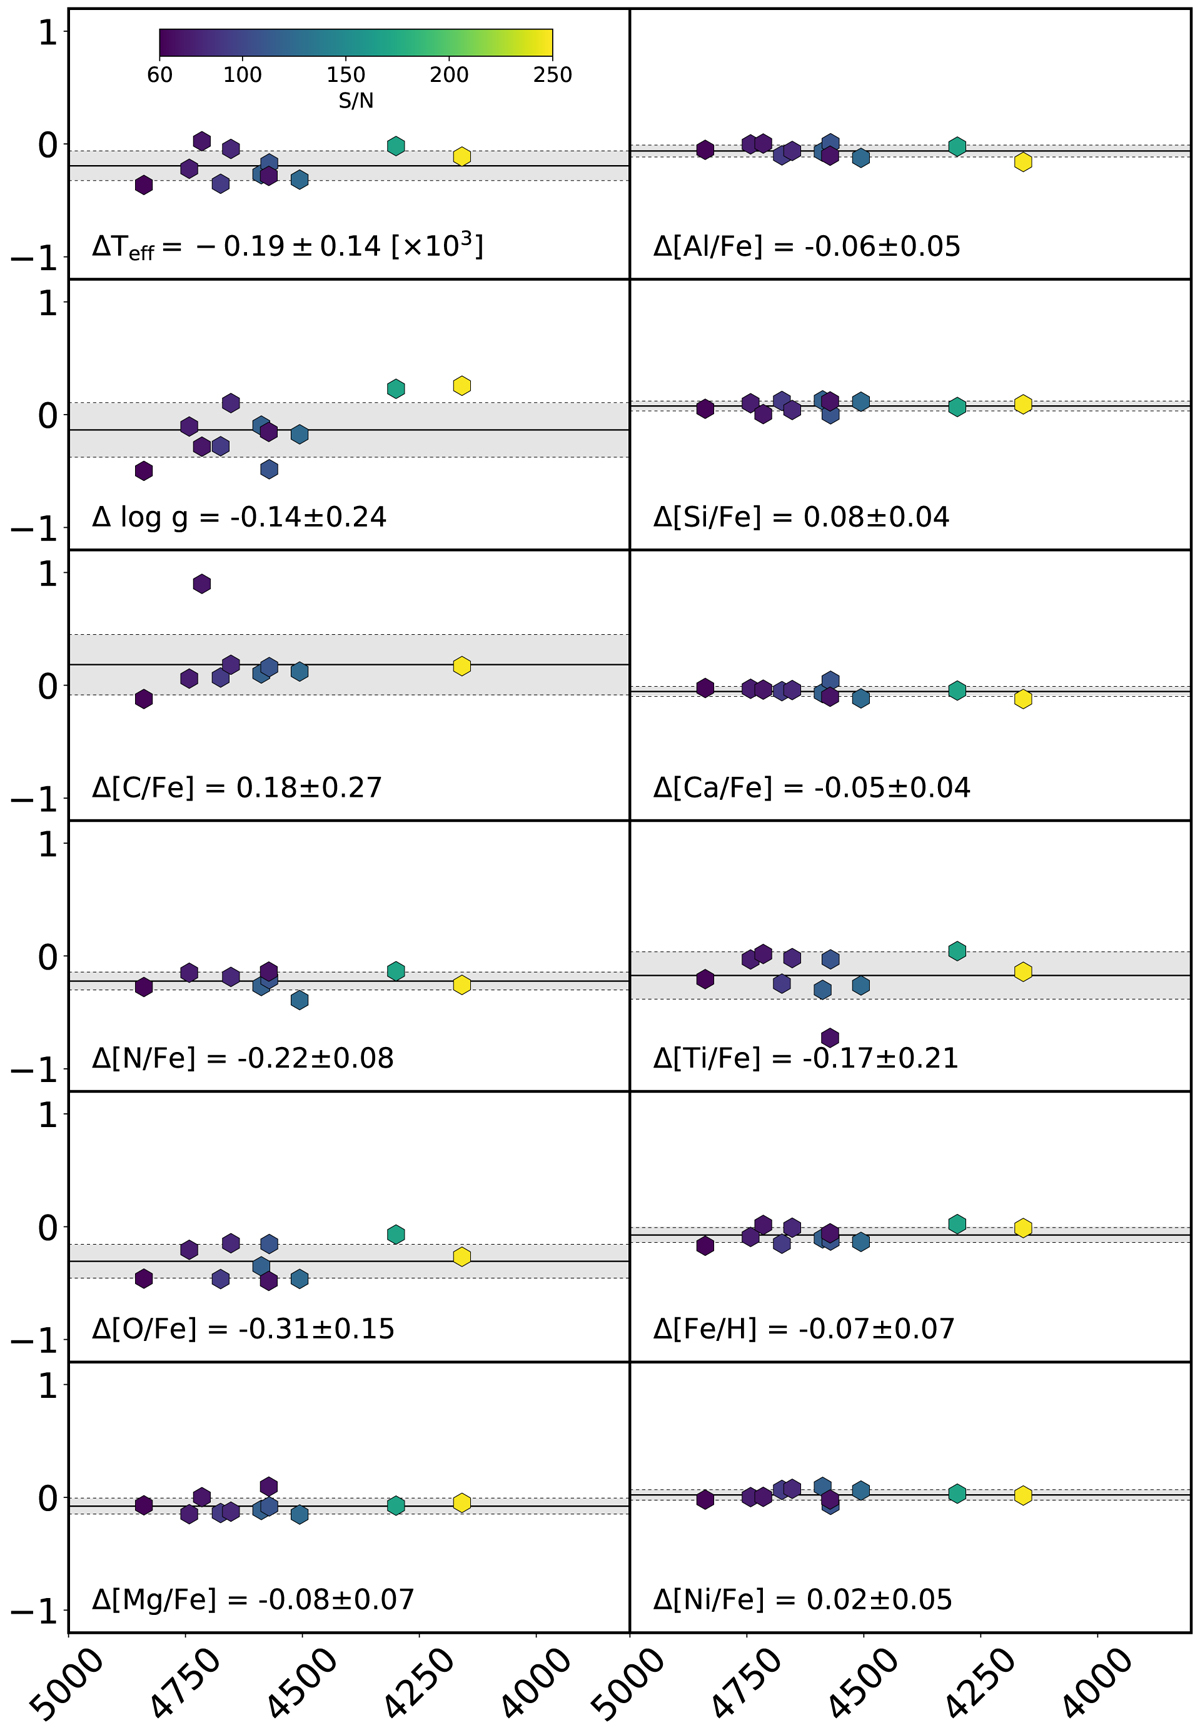
Fig. 2.
Download original image
Differences in atmospheric parameters and elemental abundances produced by two runs adopting different effective temperatures (Teff) and surface gravities (log g): photometric vs. spectroscopic values as listed in Table 2. The vertical axis refer to the Δ of every atmospheric parameter and chemical species ([X/Fe]) analyzed in this work. The horizontal axis refers to the ![]() . The hexagonal symbols are color coded by the S/N. The average and standard deviation around the mean of the differences is listed in each panel, and are denoted by a black line and gray shadow.
. The hexagonal symbols are color coded by the S/N. The average and standard deviation around the mean of the differences is listed in each panel, and are denoted by a black line and gray shadow.
Current usage metrics show cumulative count of Article Views (full-text article views including HTML views, PDF and ePub downloads, according to the available data) and Abstracts Views on Vision4Press platform.
Data correspond to usage on the plateform after 2015. The current usage metrics is available 48-96 hours after online publication and is updated daily on week days.
Initial download of the metrics may take a while.