Fig. 1.
Download original image
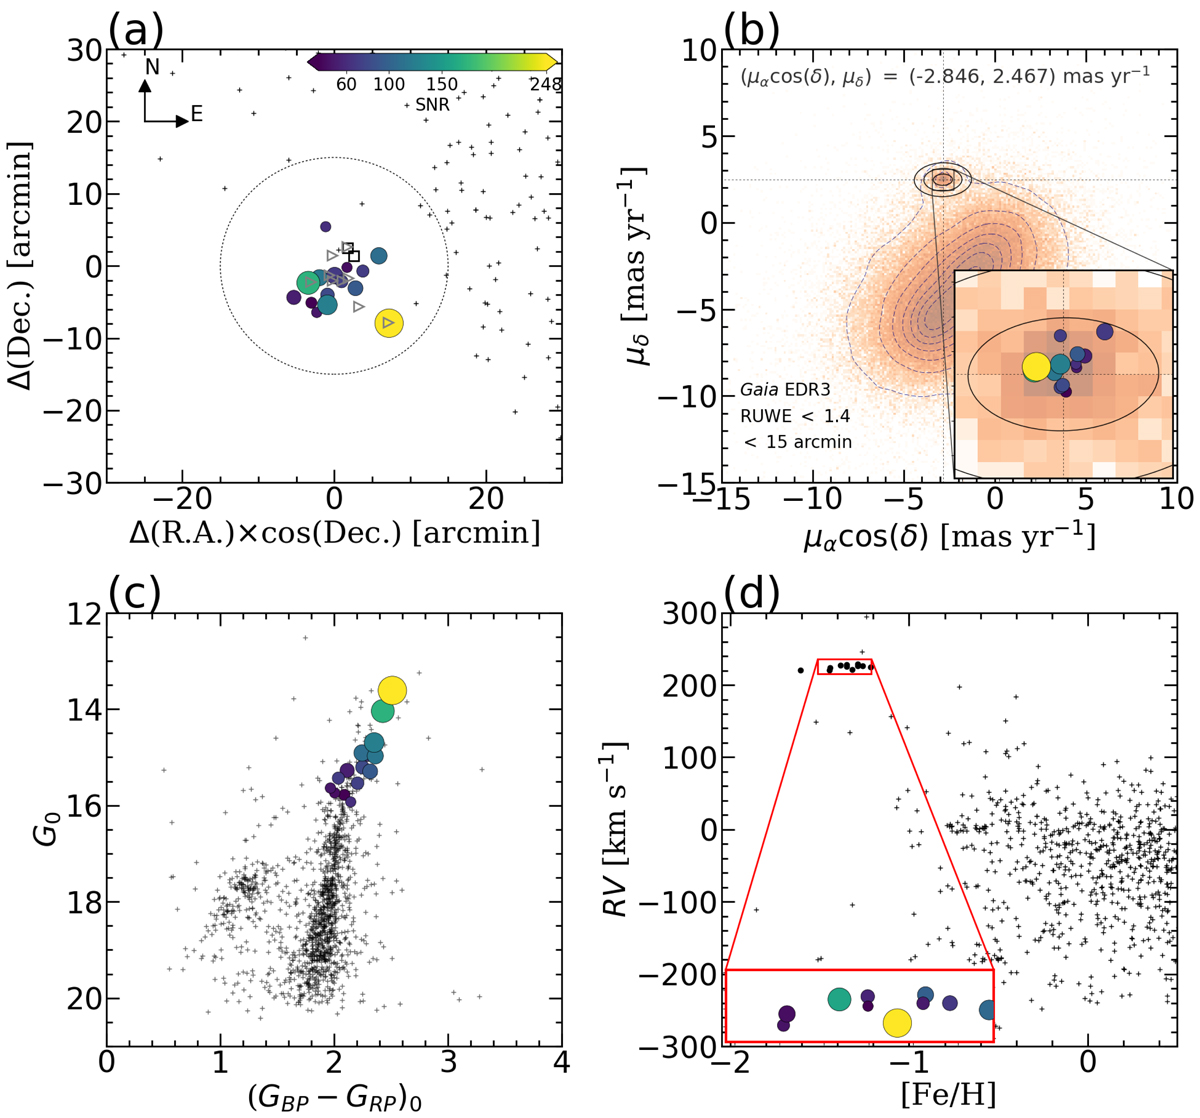
Properties of our FSR 1758 targets. Panel a: spatial position. Color-coded symbols represent the S/N of stars with APOGEE spectra whose sizes are proportional to their G mag. Open black squares and gray triangles indicate stars analyzed in Simpson (2019) and Villanova et al. (2019), respectively. Field stars represent black crosses. A circle with 15′ radius is overplotted. Panel b: proper motion density distribution of stars located within 15′ from the cluster center; the color contours refer to the kernel density estimation of this sample. FSR 1758 is clearly distinguishable from the field population. The inner plot on the top right shows a zoom-in of the cluster; concentric ellipses show the 1, 2, and 3σ levels of our best-fit proper motions (PMs) of FSR 1758 based on Gaia EDR3 data, whose mean values are highlighted. The symbols are the same as in panel a. Panel c: color-magnitude diagram corrected by differential reddening and extinction-corrected in the Gaia bands of our sample and stars within 15′. Our targets all lie along the RGB. Panel d: radial velocity vs. metallicity of our members compared to field stars. The [Fe/H] of our targets have been determined with BACCHUS and photometric atmospheric parameters (see Table 2), while the [Fe/H] of field stars are from the ASPCAP pipeline. The red box limited by ±0.15 dex and ±10 km s−1 and centered on [Fe/H] = − 1.36 and RV = 225.73 km s−1 encloses our potential cluster members.
Current usage metrics show cumulative count of Article Views (full-text article views including HTML views, PDF and ePub downloads, according to the available data) and Abstracts Views on Vision4Press platform.
Data correspond to usage on the plateform after 2015. The current usage metrics is available 48-96 hours after online publication and is updated daily on week days.
Initial download of the metrics may take a while.