Fig. 3.
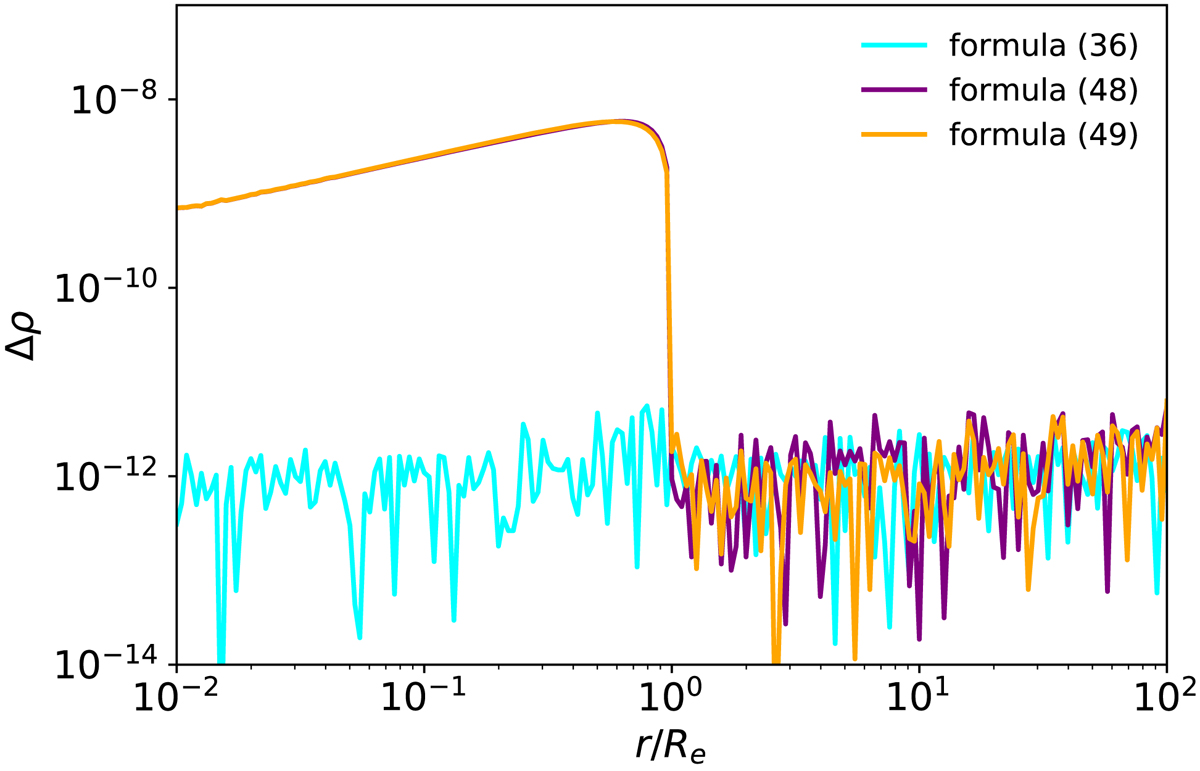
Absolute value of the relative error of the density of the Vaucouleurs model, as calculated by SpheCow. The cyan line corresponds to the calculation using the standard deprojection Eq. (36), the purple line to the integration of the isotropic distribution function over velocity space (48), and the orange line to the integration of the Osipkov-Merritt distribution function over velocity space (49).
Current usage metrics show cumulative count of Article Views (full-text article views including HTML views, PDF and ePub downloads, according to the available data) and Abstracts Views on Vision4Press platform.
Data correspond to usage on the plateform after 2015. The current usage metrics is available 48-96 hours after online publication and is updated daily on week days.
Initial download of the metrics may take a while.