Free Access
Fig. 1.
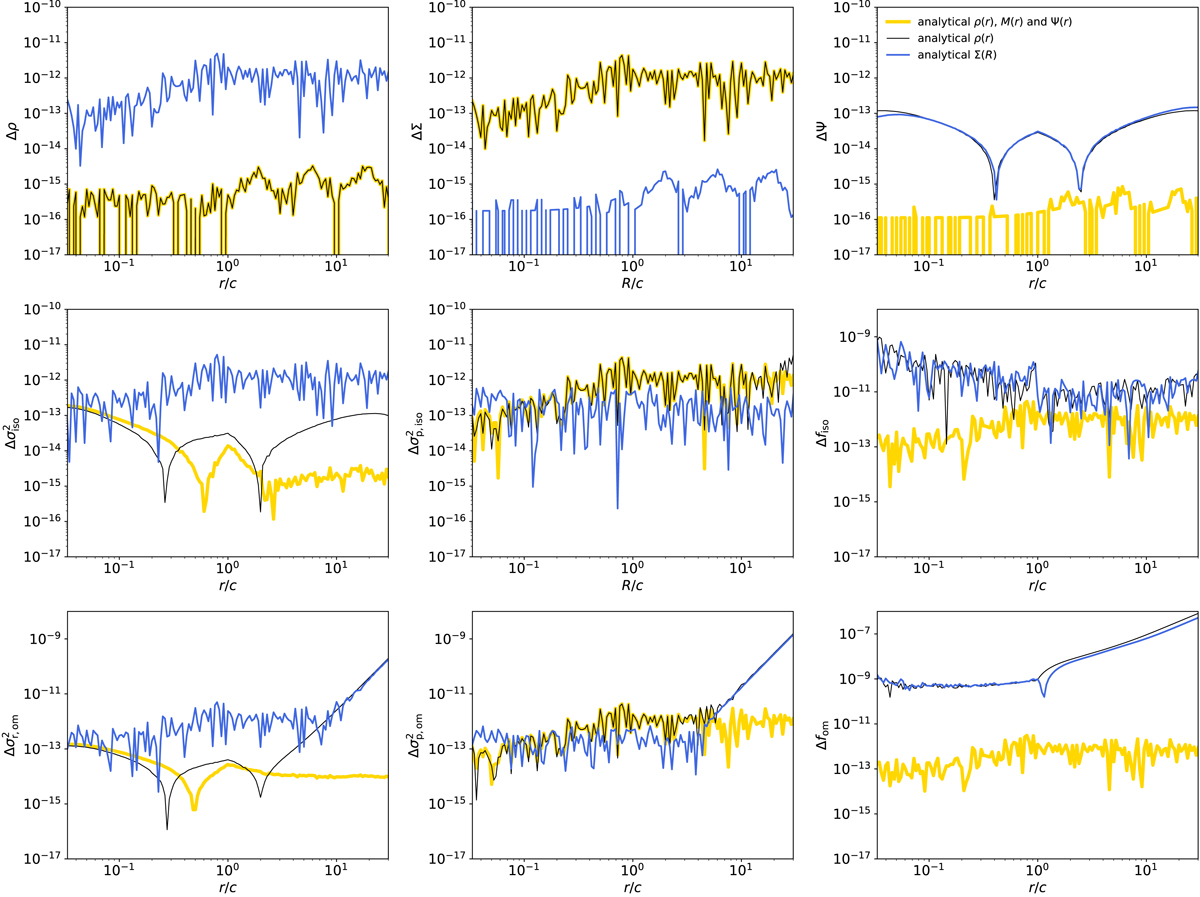
Absolute value of the relative error of the density, surface density, potential, velocity dispersion, projected dispersion, and distribution function of the Plummer model (c represents the scale radius of the Plummer model). See text in Sect. 4.1 for the meaning of the different curves in each panel.
Current usage metrics show cumulative count of Article Views (full-text article views including HTML views, PDF and ePub downloads, according to the available data) and Abstracts Views on Vision4Press platform.
Data correspond to usage on the plateform after 2015. The current usage metrics is available 48-96 hours after online publication and is updated daily on week days.
Initial download of the metrics may take a while.