Fig. 5
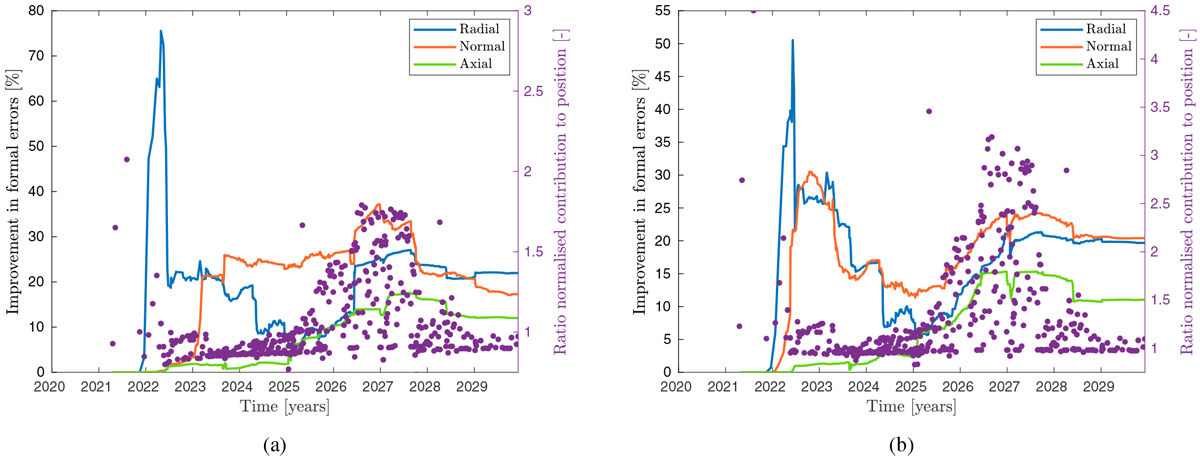
Reduction in formal errors obtained by using central instants instead of alternative observables, as more observations are added to the solution. It is displayed on the left axis, for the three position components in RSW frame (panel a: Io, panel b: Europa). On the right axis (purple dots), the ratio between the normalised contributions of central instants over their corresponding alternative observables is displayed, for each mutual approximation (normalised contributions are computed as in Eq. (43)). As mentioned in Sect. 3.1, the first simulated observation only occurs towards the end of 2021, hence the lack of data beforehand.
Current usage metrics show cumulative count of Article Views (full-text article views including HTML views, PDF and ePub downloads, according to the available data) and Abstracts Views on Vision4Press platform.
Data correspond to usage on the plateform after 2015. The current usage metrics is available 48-96 hours after online publication and is updated daily on week days.
Initial download of the metrics may take a while.