Fig. 4
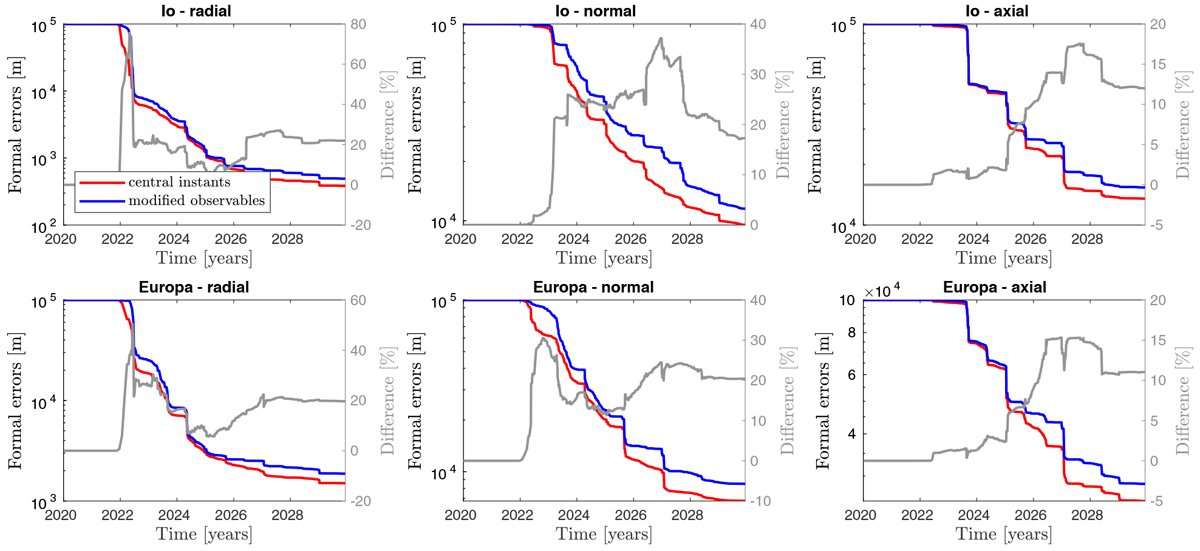
Time evolution of the formal errors in Io’s and Europa’s initial RSW coordinates (radial, normal, and axial directions, see Fig. 2), as more observations are progressively included in the state estimation. The blue line displays the time evolution of the formal errors obtained by using the central instants as observables (left y-axis). The red line corresponds to the time evolution of the formal errors obtained from alternative observables (left y-axis too). The initial values of the formal errors, before including any observation, correspond to the a priori covariance values used for the regularisation (i.e. 100 km, see Sect. 3.2). The grey line (right y-axis) represents the relative difference (in percentage) between the two solutions as a function of time. The formal errors are equal to their initial values until the inclusion of the first mutual approximation (towards the end of 2021) and no difference between the two observables’ solutions is thus observed beforehand.
Current usage metrics show cumulative count of Article Views (full-text article views including HTML views, PDF and ePub downloads, according to the available data) and Abstracts Views on Vision4Press platform.
Data correspond to usage on the plateform after 2015. The current usage metrics is available 48-96 hours after online publication and is updated daily on week days.
Initial download of the metrics may take a while.