Fig. A.1
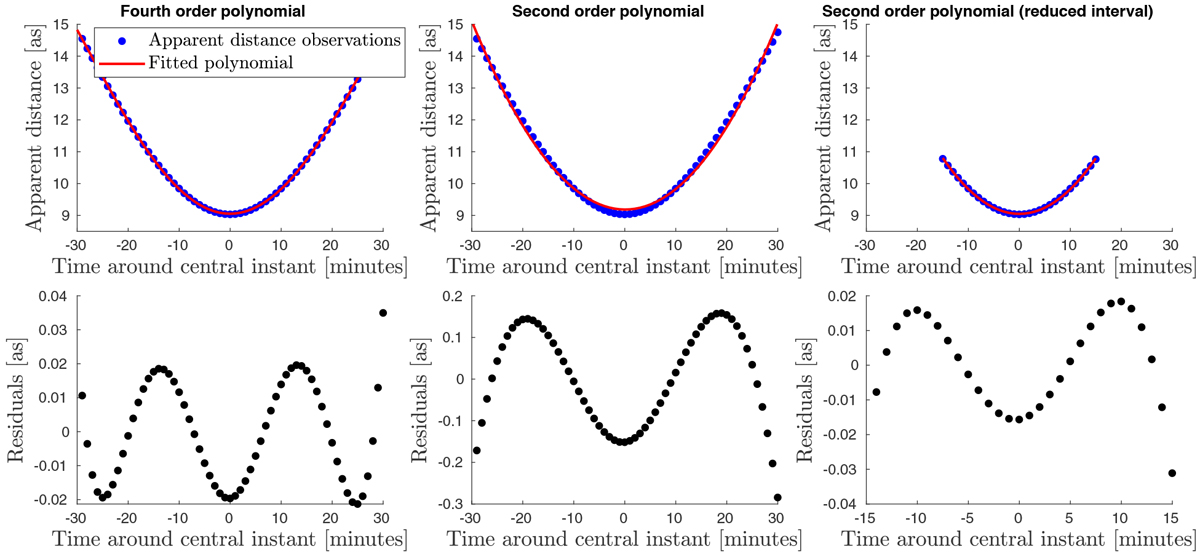
Apparent distance measurements during a mutual approximation (blue dots on top panels). The polynomial used to fit these observations is typically a fourth order one (left panel). A second order polynomial was also tested, for the whole duration of the event (middle panels) and over a reduced time interval (30 min) centred on the central instant tc. For each of the three case, the residuals between the fitted polynomial and the true apparent distance history are displayed in the bottom panels.
Current usage metrics show cumulative count of Article Views (full-text article views including HTML views, PDF and ePub downloads, according to the available data) and Abstracts Views on Vision4Press platform.
Data correspond to usage on the plateform after 2015. The current usage metrics is available 48-96 hours after online publication and is updated daily on week days.
Initial download of the metrics may take a while.