Fig. 10
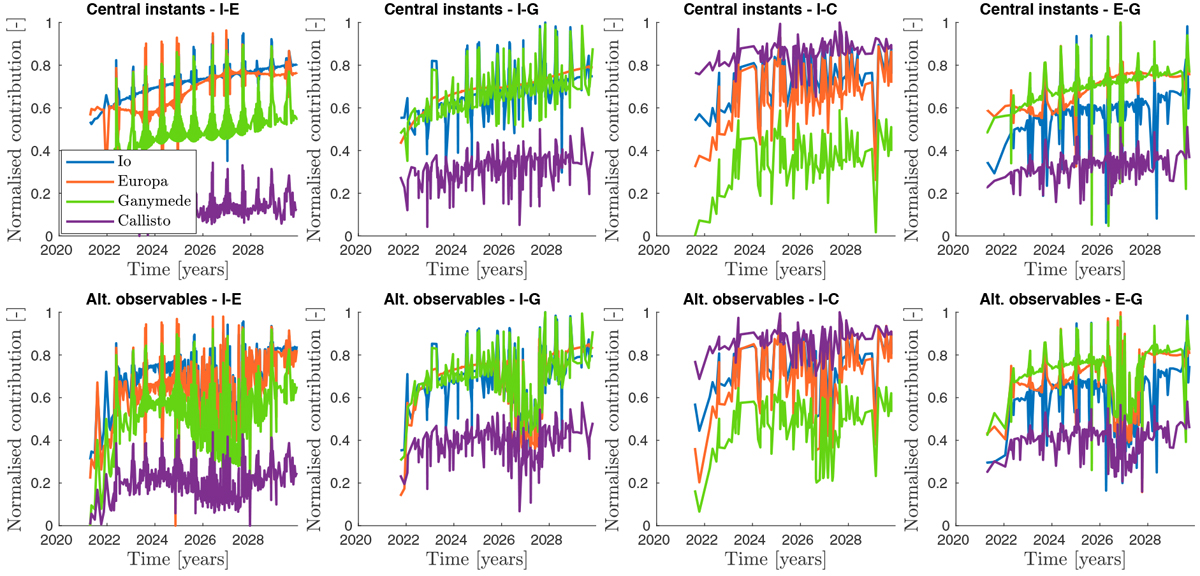
Normalised contribution of mutual approximations between Io and Europa (I-E, left plots), Io and Ganymede (I-G, centre-left plots), Io and Callisto (I-C, centre-right plots), Europa and Ganymede (E-G, right plots) to the initial position of Io (blue), Europa (orange), Ganymede (green), and Callisto (purple). Results for Europa-Callisto and Ganymede-Callisto mutual approximations are not represented here, but do not show any trend that is not already highlighted by the contributions of the other observations. The first simulated observation only happens at the end of year 2021, explaining the lack of data before that date.
Current usage metrics show cumulative count of Article Views (full-text article views including HTML views, PDF and ePub downloads, according to the available data) and Abstracts Views on Vision4Press platform.
Data correspond to usage on the plateform after 2015. The current usage metrics is available 48-96 hours after online publication and is updated daily on week days.
Initial download of the metrics may take a while.