Fig. 1
Download original image
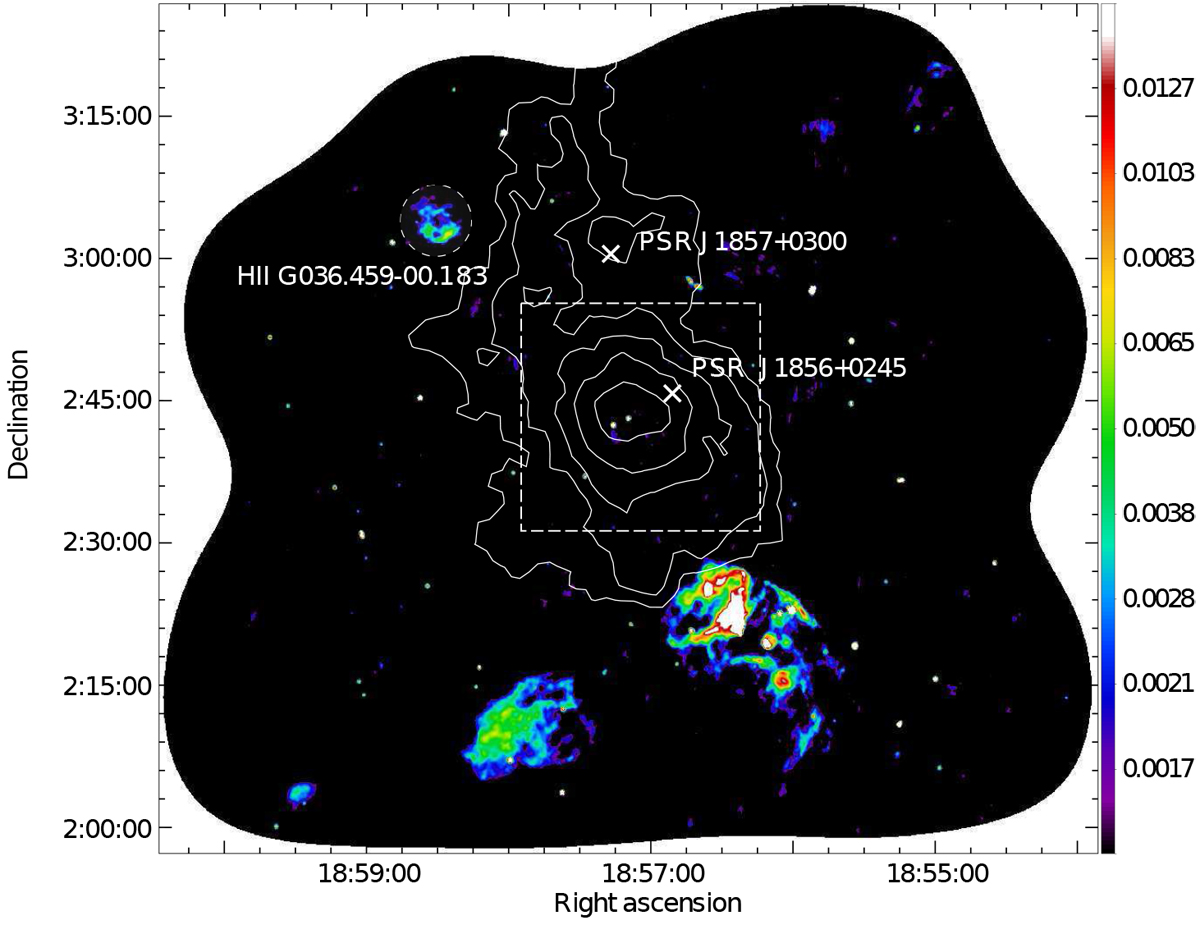
Radio continuum emission at 1.5 GHz. The white crosses indicate the positions of the pulsars PSR J1856+0245 and PSR J1857+0300. The white square shows the region mapped in the C band with the VLA and the contours represent the TeV emission below 1 TeV extracted from H. E. S. S. Collaboration (2018) with values of 1.5, 2.0, 2.7, 3.5, and 4.5 in units of 10−13 ph cm−2 s−1. The angular resolution is 17.′′38 × 15.′′ 51, PA = 6°.87 and the noise is 0.7 mJy beam−1. The color scale is expressed in Jy beam−1.
Current usage metrics show cumulative count of Article Views (full-text article views including HTML views, PDF and ePub downloads, according to the available data) and Abstracts Views on Vision4Press platform.
Data correspond to usage on the plateform after 2015. The current usage metrics is available 48-96 hours after online publication and is updated daily on week days.
Initial download of the metrics may take a while.