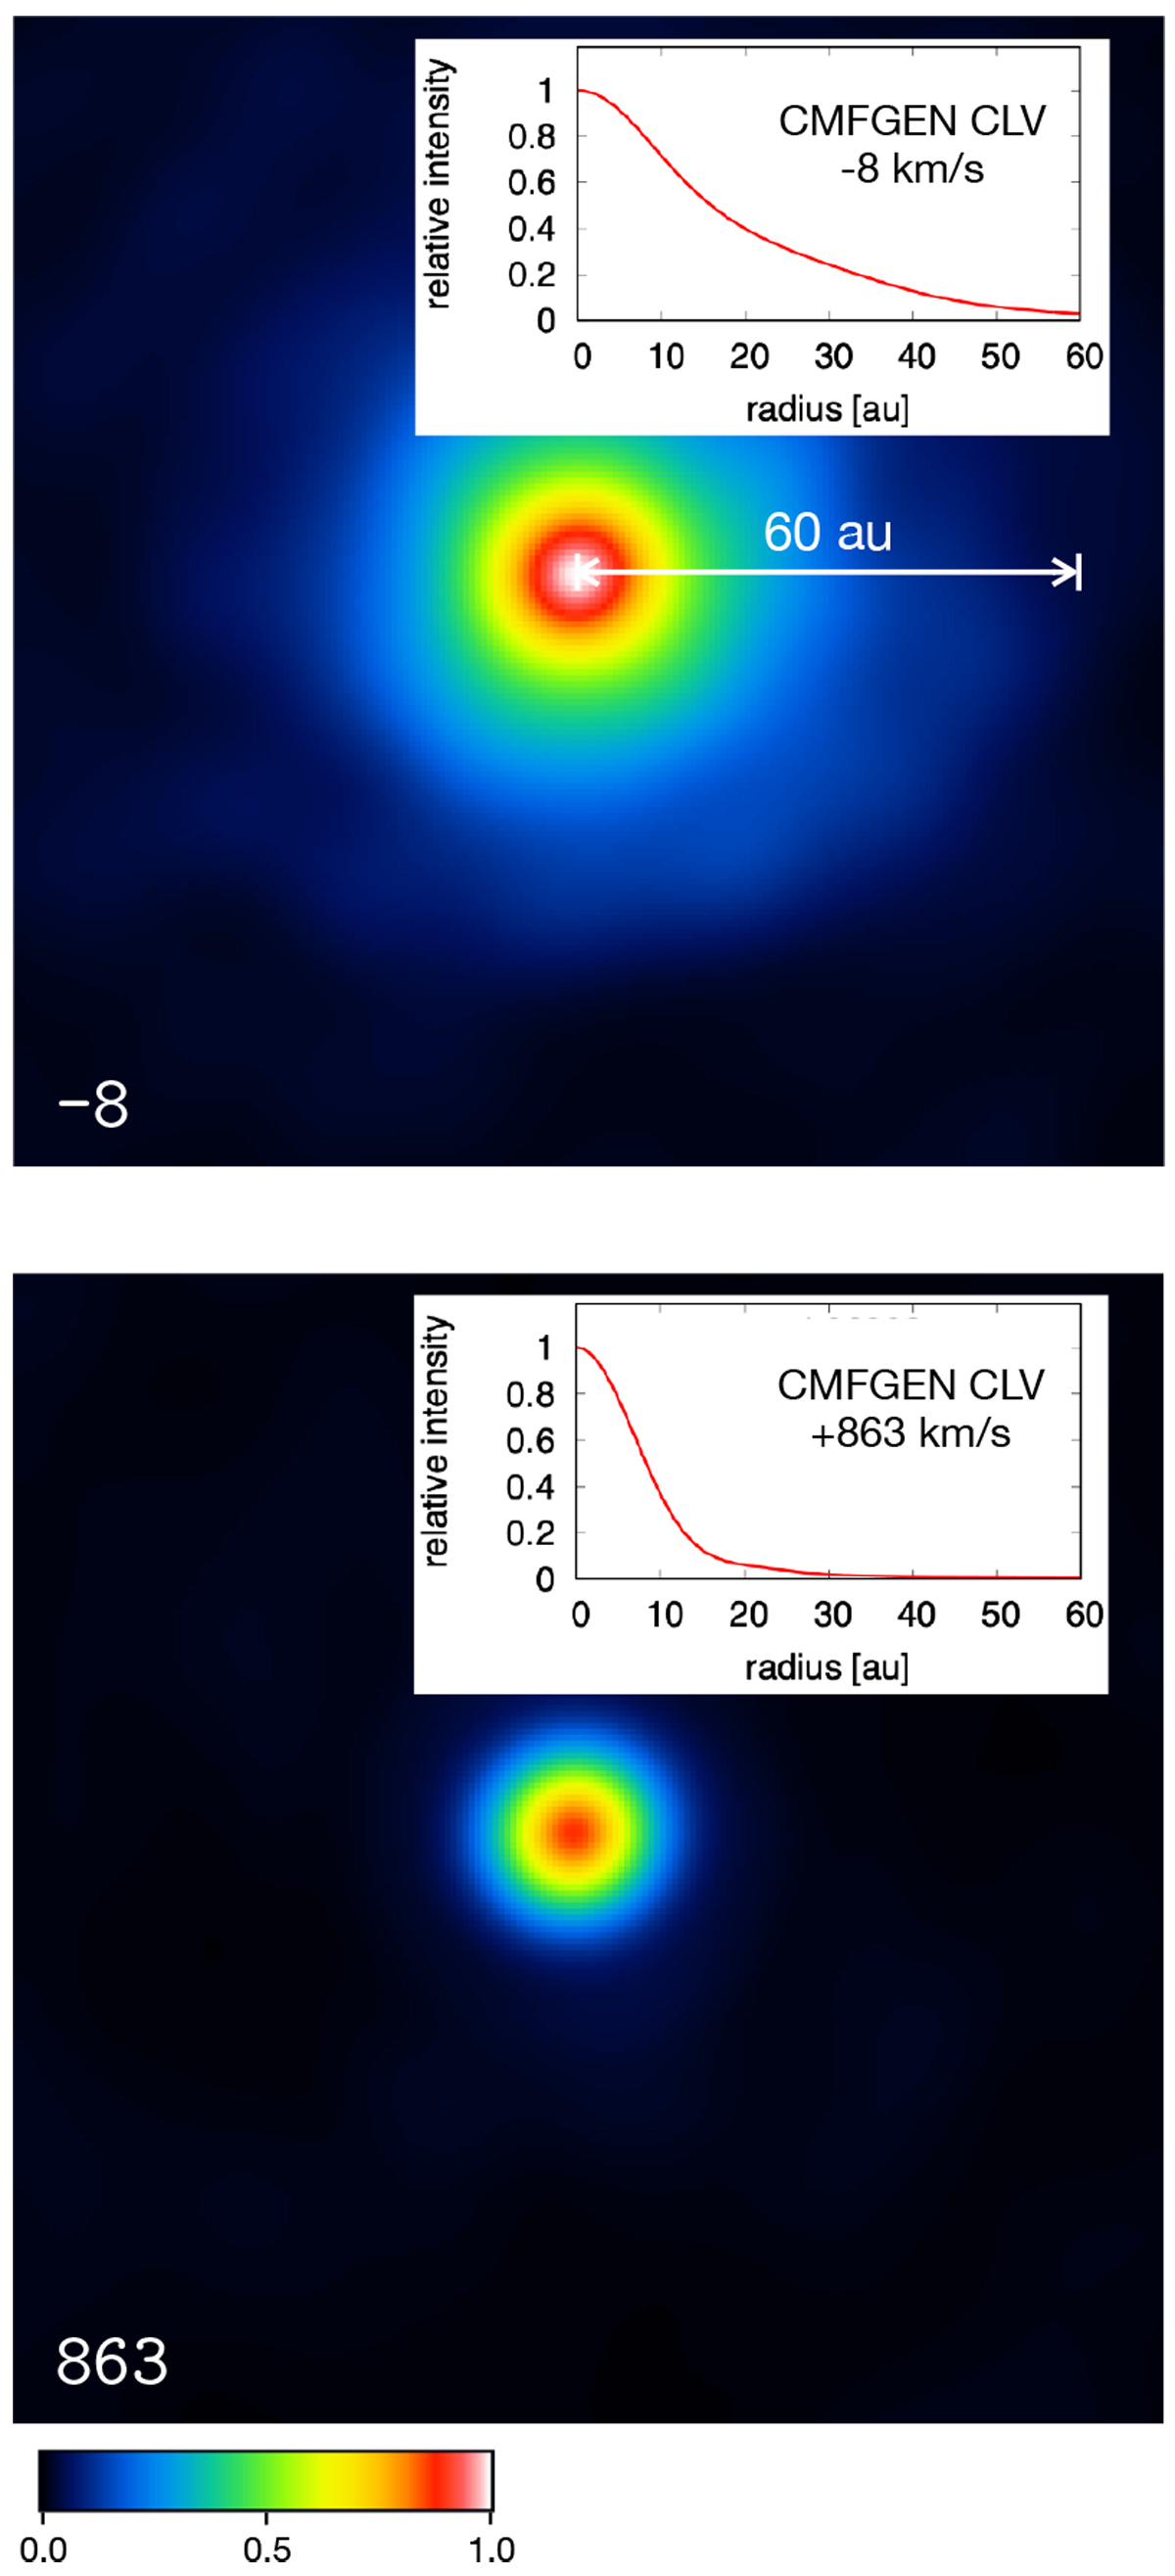
Fig. 6
Download original image
Comparison of the intensity distribution of two images from Fig. 1 (− 8 and + 863 km s−1) with the intensity CLV of the stellar wind CMFGEN model. The model CLVs are convolved with a point spread function with 6 mas diameter to match the resolution of the observed images. Top: Brα stellar wind image of the primary star at the velocity of − 8 km s−1 and the corresponding CMFGEN model. Bottom: continuum + 863 km s−1 image of thestellar wind of the primary star and the corresponding CMFGEN model.
Current usage metrics show cumulative count of Article Views (full-text article views including HTML views, PDF and ePub downloads, according to the available data) and Abstracts Views on Vision4Press platform.
Data correspond to usage on the plateform after 2015. The current usage metrics is available 48-96 hours after online publication and is updated daily on week days.
Initial download of the metrics may take a while.