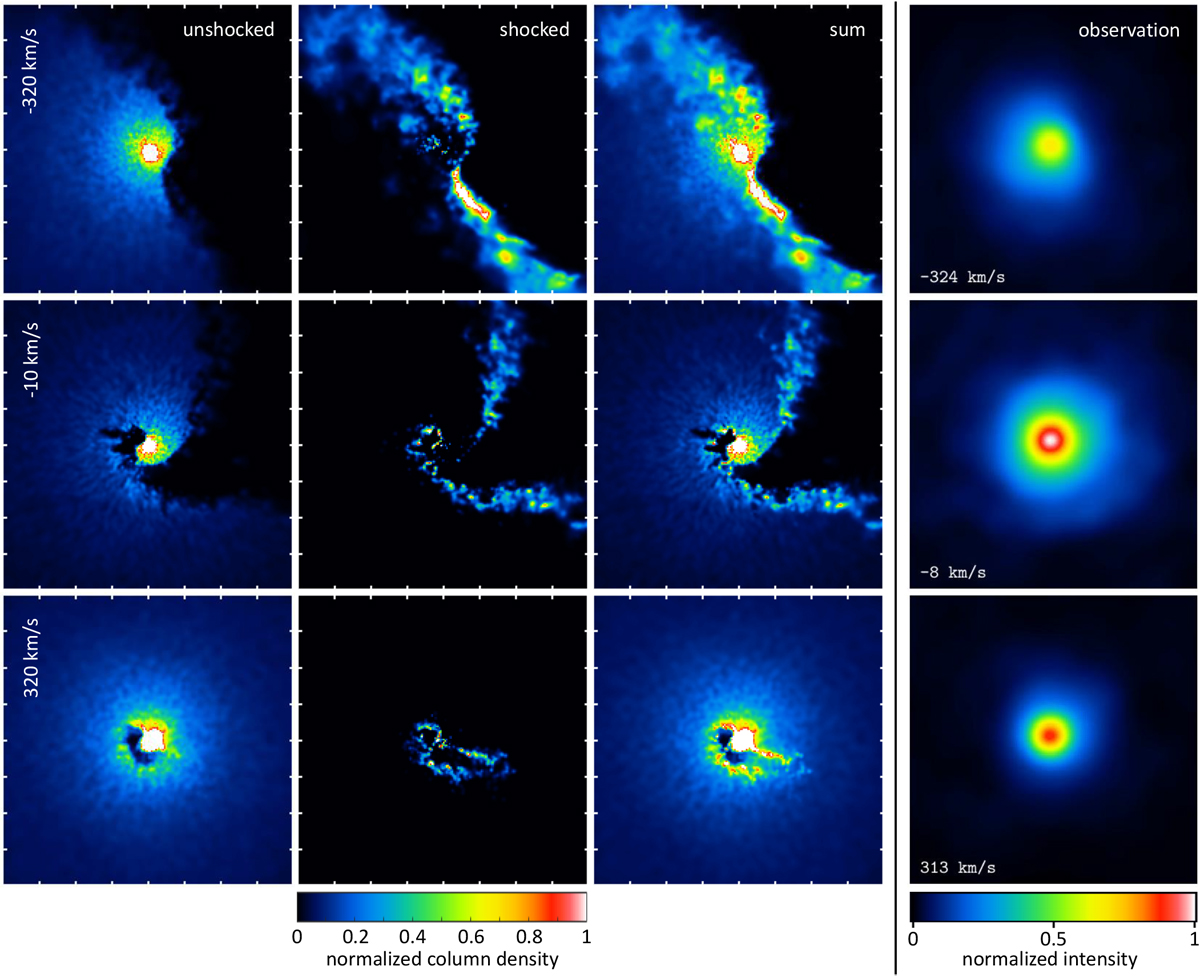
Fig. 5
Download original image
Comparison of η Car images (fourth column) from Fig. 1 with 3D hydrodynamic simulations of LOS column density distributionsof η Car’s distorted stellar wind and WWC zone of the primary star only for the three LOS velocities of − 320, − 10, and + 320 km s−1. The model images show the LOS view as seen on the sky at orbital phase ϕ = 0.014, i.e., very close to the phase of 0.0022 of the observations. Top: LOS velocity of − 320 km s−1. Middle: LOSvelocity of − 10 km s−1. Bottom: LOS velocity of + 320 km s−1. From left to right are shown the un-shocked wind column density distribution, shocked wind column density distribution, the model sum of both (shocked plus un-shocked), and the observed images at similar LOS velocities. The FOV of all model column density maps and observed images is 60 × 60 mas or 138 × 138 au for the adopted distance of 2.3 kpc. N is up, and E is to the left.
Current usage metrics show cumulative count of Article Views (full-text article views including HTML views, PDF and ePub downloads, according to the available data) and Abstracts Views on Vision4Press platform.
Data correspond to usage on the plateform after 2015. The current usage metrics is available 48-96 hours after online publication and is updated daily on week days.
Initial download of the metrics may take a while.