Fig. 3
Download original image
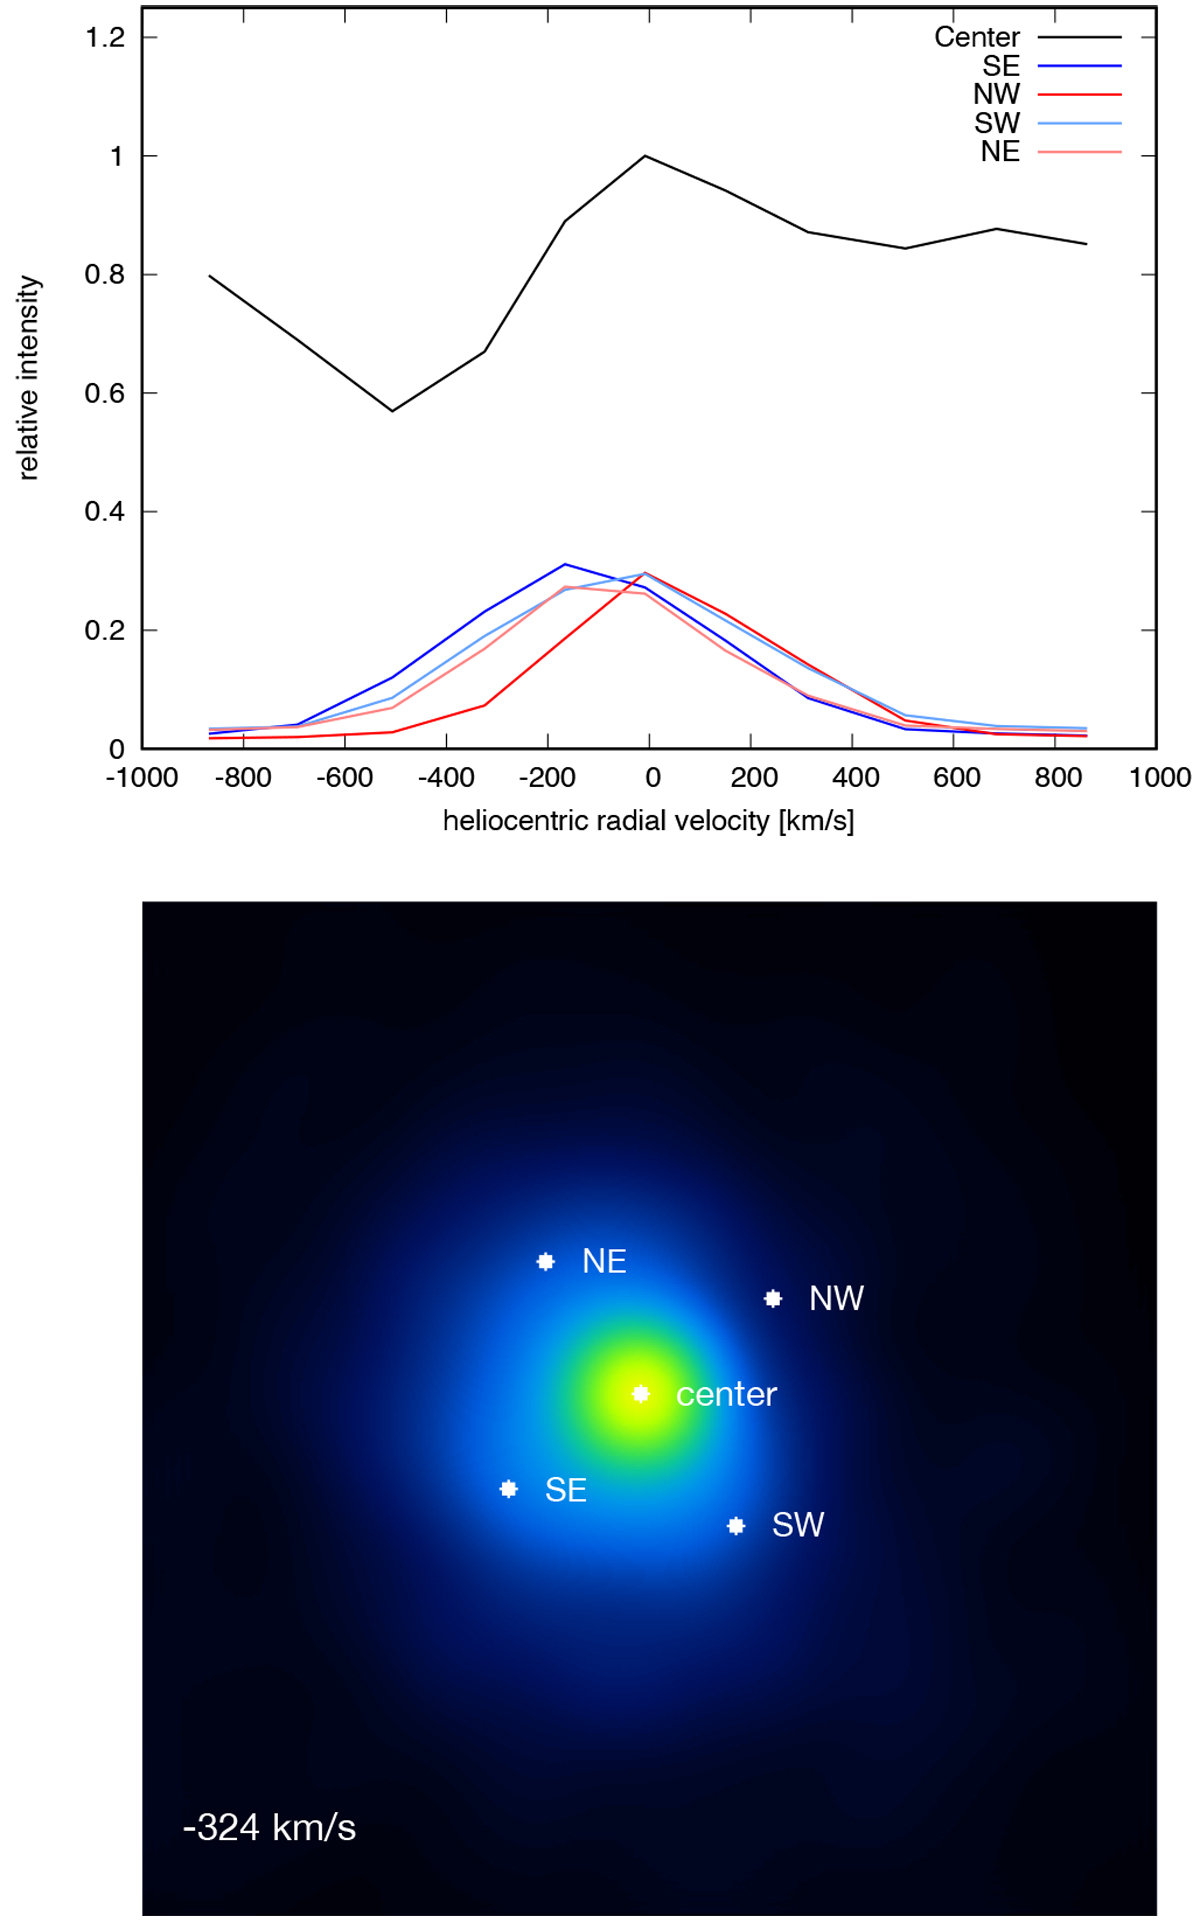
Extraction of spectra from the 3D data cube in Fig. 1. Top: five spectra extracted at five selected positions from the 11 iso-velocity images in Fig. 1. Bottom: five positions chosen in the images in Fig. 1 to extract five spectra (top) from the 3D data cube of Fig. 1, shown by the dots at center, NE, SE, SW, and NW (same color table as in Fig. 1).
Current usage metrics show cumulative count of Article Views (full-text article views including HTML views, PDF and ePub downloads, according to the available data) and Abstracts Views on Vision4Press platform.
Data correspond to usage on the plateform after 2015. The current usage metrics is available 48-96 hours after online publication and is updated daily on week days.
Initial download of the metrics may take a while.