Open Access
Fig. D.1
Download original image
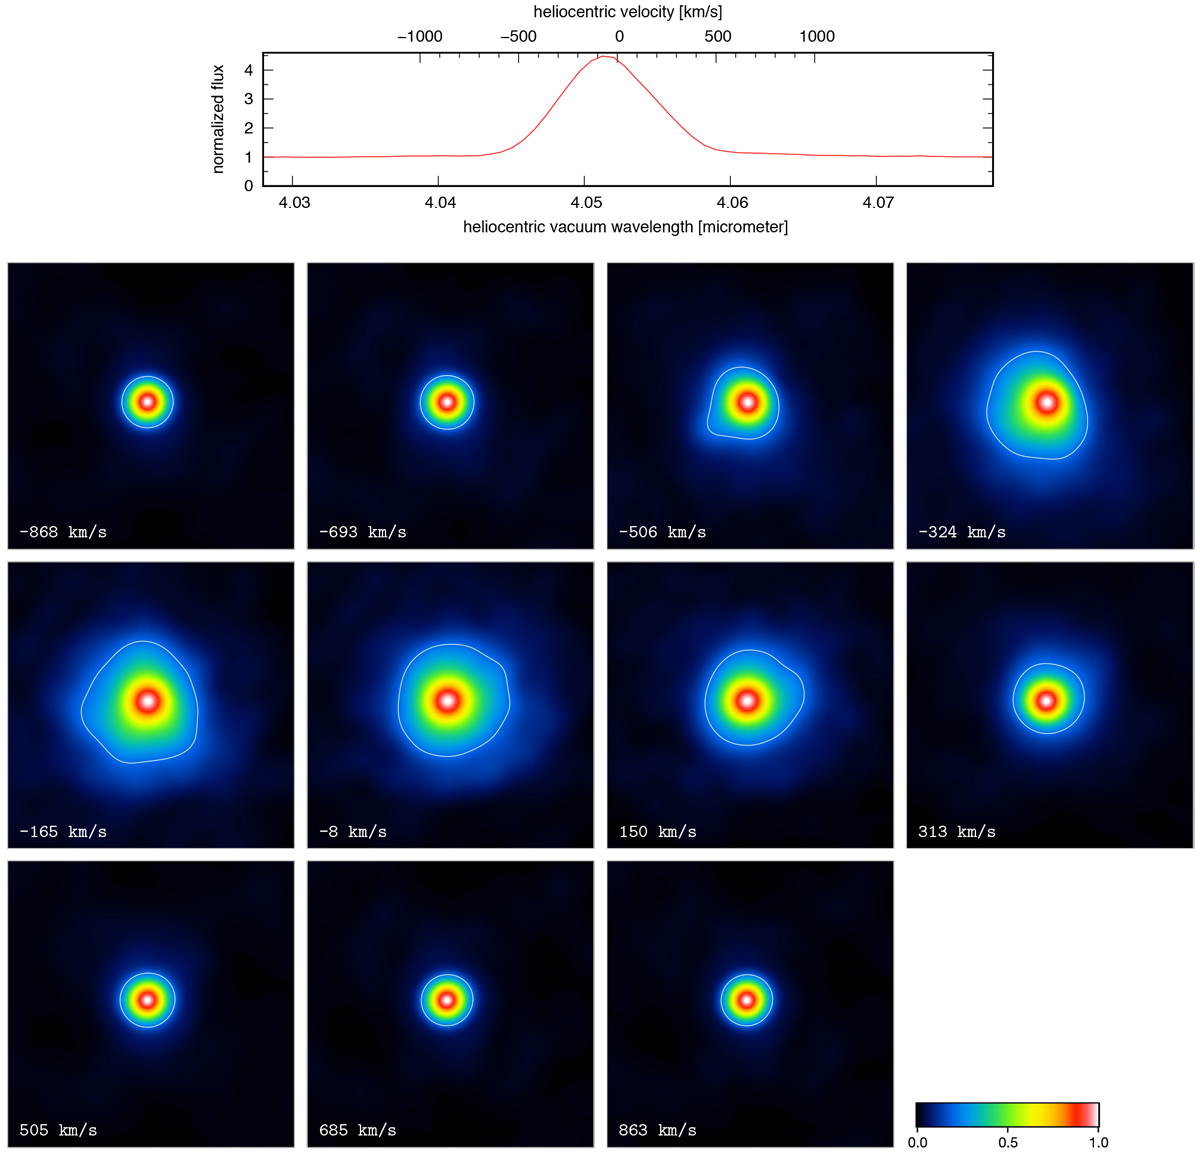
Same images as in Fig. 1, but different intensity normalization. All images are individually normalized to unity at the brightest pixel of the central peak. Contour lines are plotted at 20% and 98% of the peak intensity (the 98% contour is difficult to see but is useful for asymmetry measurements).
Current usage metrics show cumulative count of Article Views (full-text article views including HTML views, PDF and ePub downloads, according to the available data) and Abstracts Views on Vision4Press platform.
Data correspond to usage on the plateform after 2015. The current usage metrics is available 48-96 hours after online publication and is updated daily on week days.
Initial download of the metrics may take a while.