Fig. C.1
Download original image
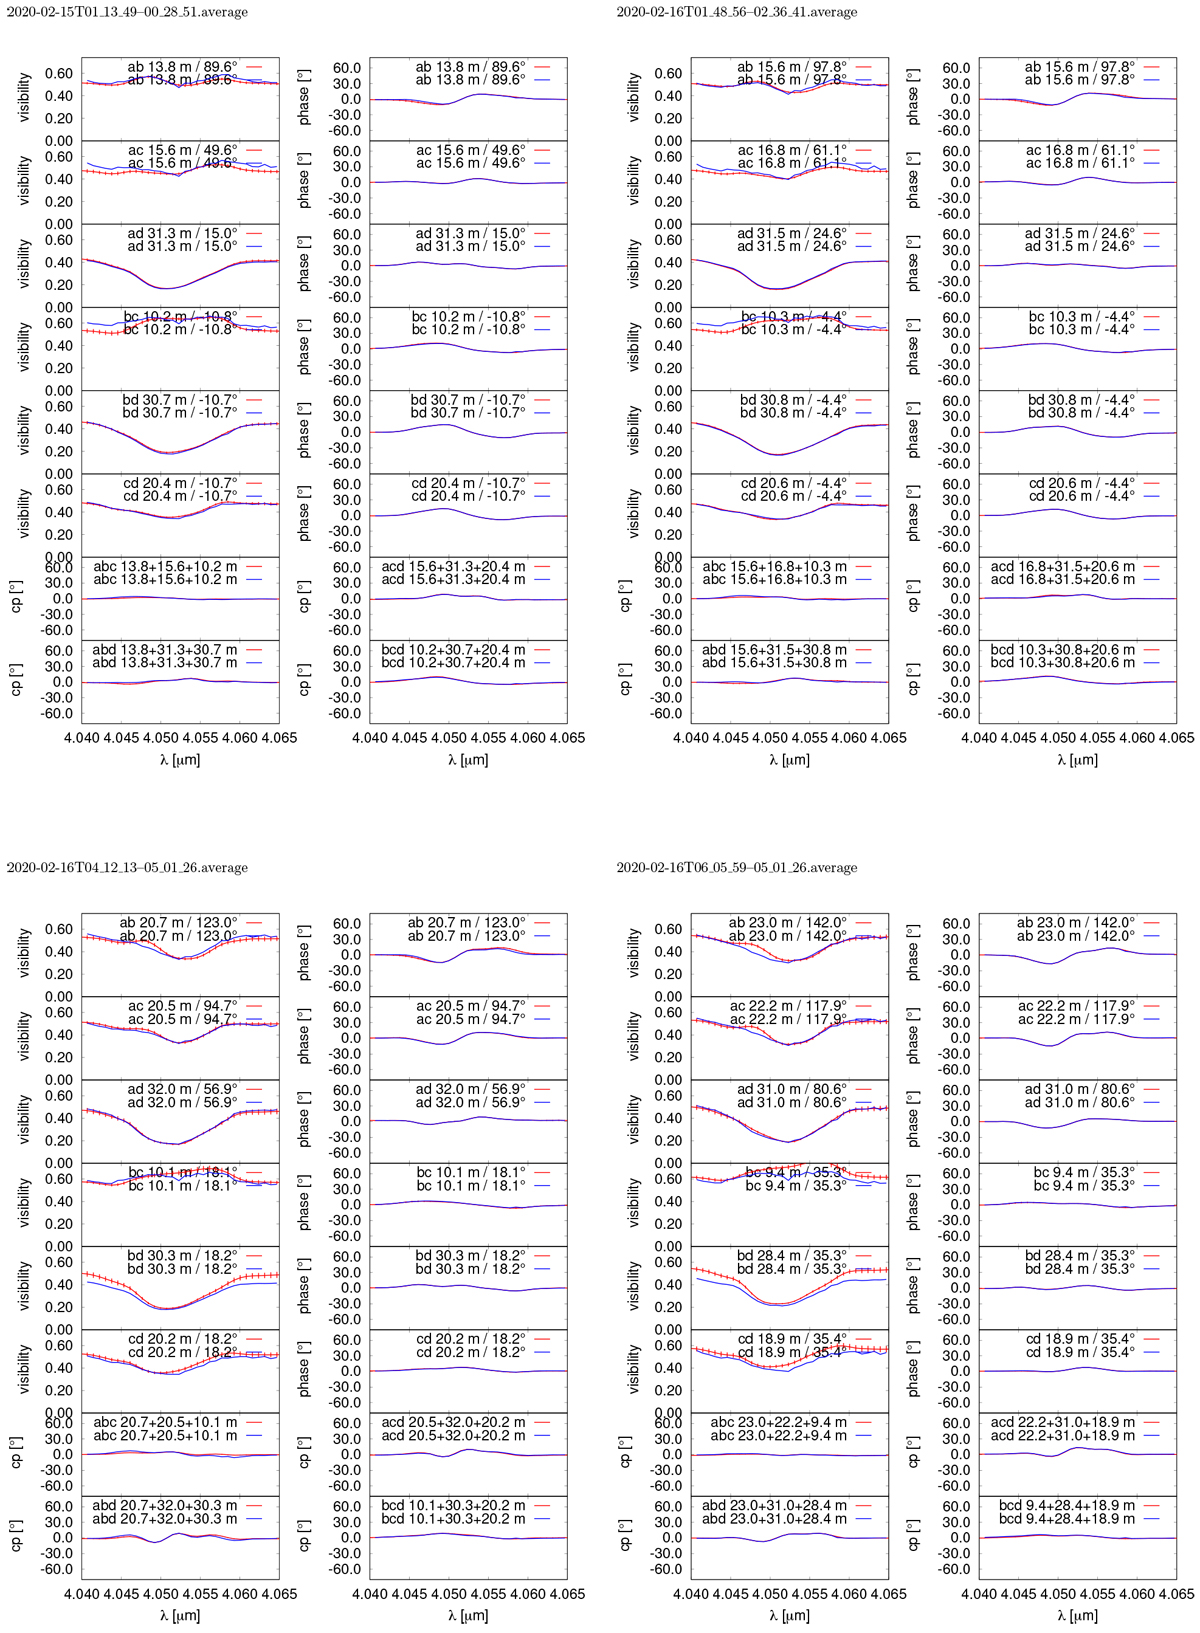
Comparison of the observed (red lines with error bars) visibilities, closure phases (“cp” in the figure), and phases of the object Fourier transform (“phase” in the figure) with the same interferometric quantities derived from the reconstructed images (blue lines). Dates and times of the observations are given at the top. The projected baseline lengths and PAs areinserted in each panel.
Current usage metrics show cumulative count of Article Views (full-text article views including HTML views, PDF and ePub downloads, according to the available data) and Abstracts Views on Vision4Press platform.
Data correspond to usage on the plateform after 2015. The current usage metrics is available 48-96 hours after online publication and is updated daily on week days.
Initial download of the metrics may take a while.