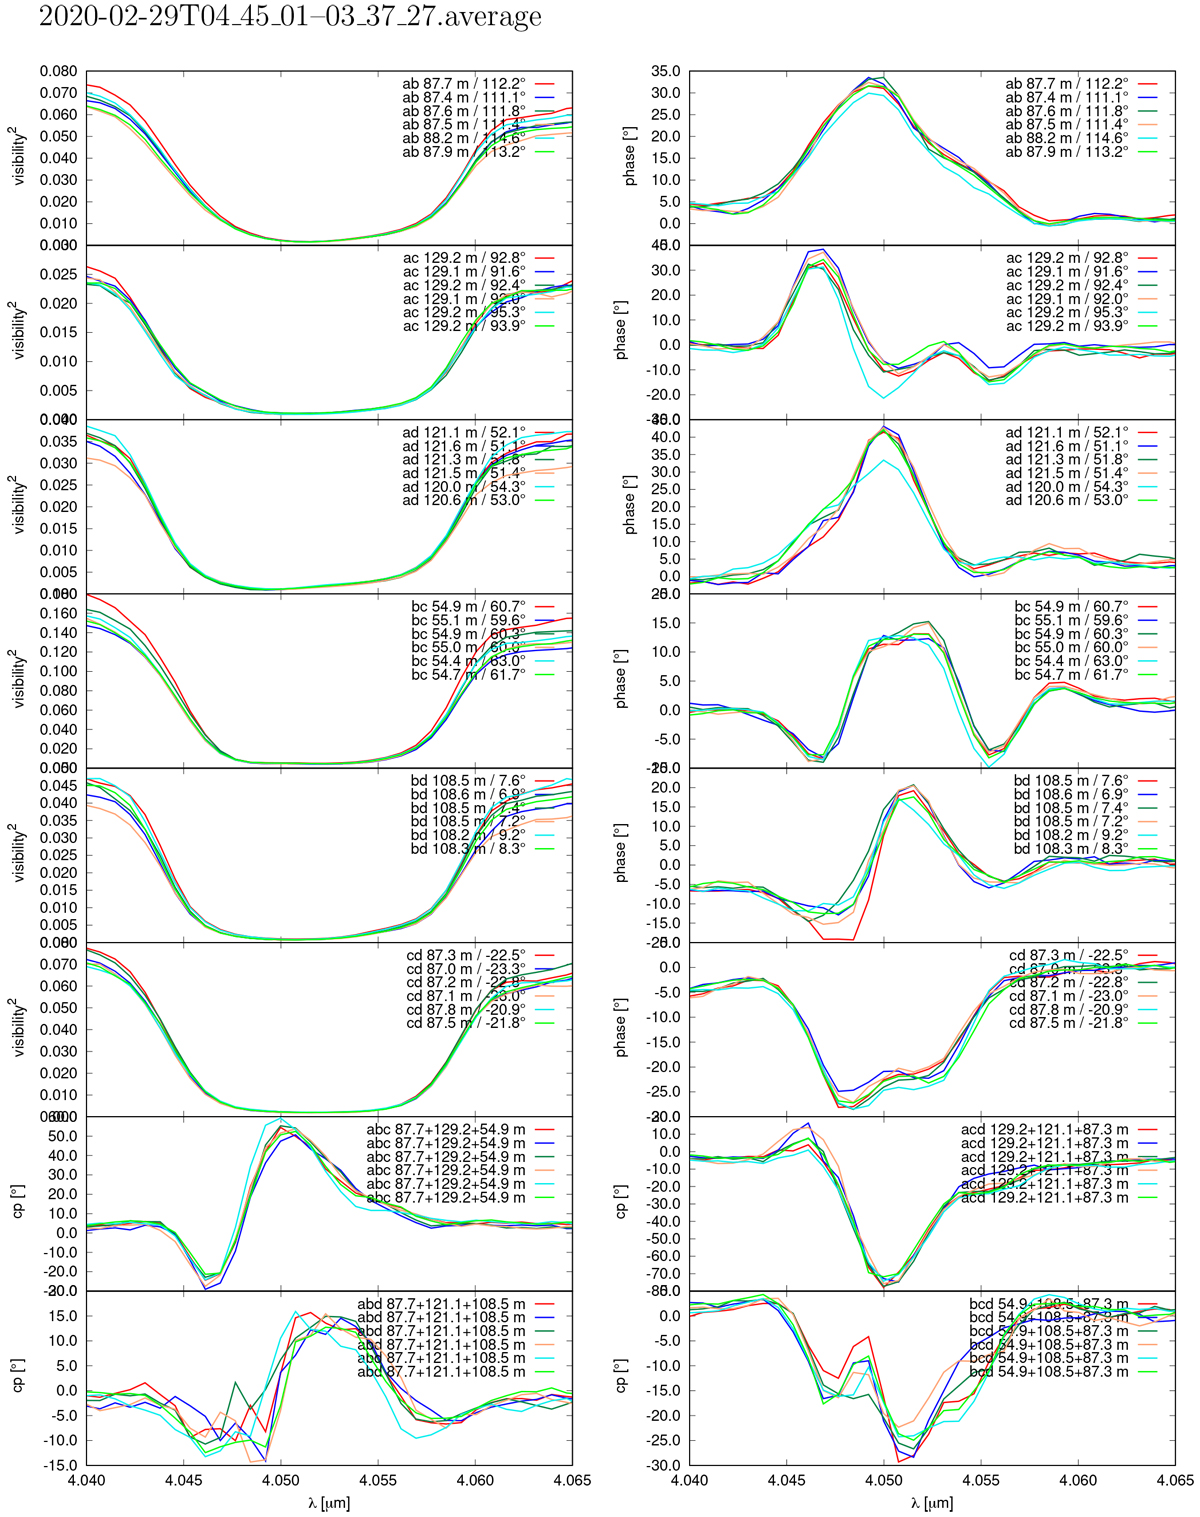
Fig. B.1
Download original image
Illustrative example of the wavelength-dependent observables of one of the 17 η Car measurements (projected baselines up to 129 m; see Sect. 2). The panels show the wavelength dependence of flux, visibilities, closure phases, and phases of the Fourier transform of η Car. Baselinelengths and PAs of the baselines are indicated in the panels. The different colored lines are measurements taken at different times (separated by ~1 min, i.e., different atmospheric conditions) with different configurations of the MATISSE BCD.
Current usage metrics show cumulative count of Article Views (full-text article views including HTML views, PDF and ePub downloads, according to the available data) and Abstracts Views on Vision4Press platform.
Data correspond to usage on the plateform after 2015. The current usage metrics is available 48-96 hours after online publication and is updated daily on week days.
Initial download of the metrics may take a while.