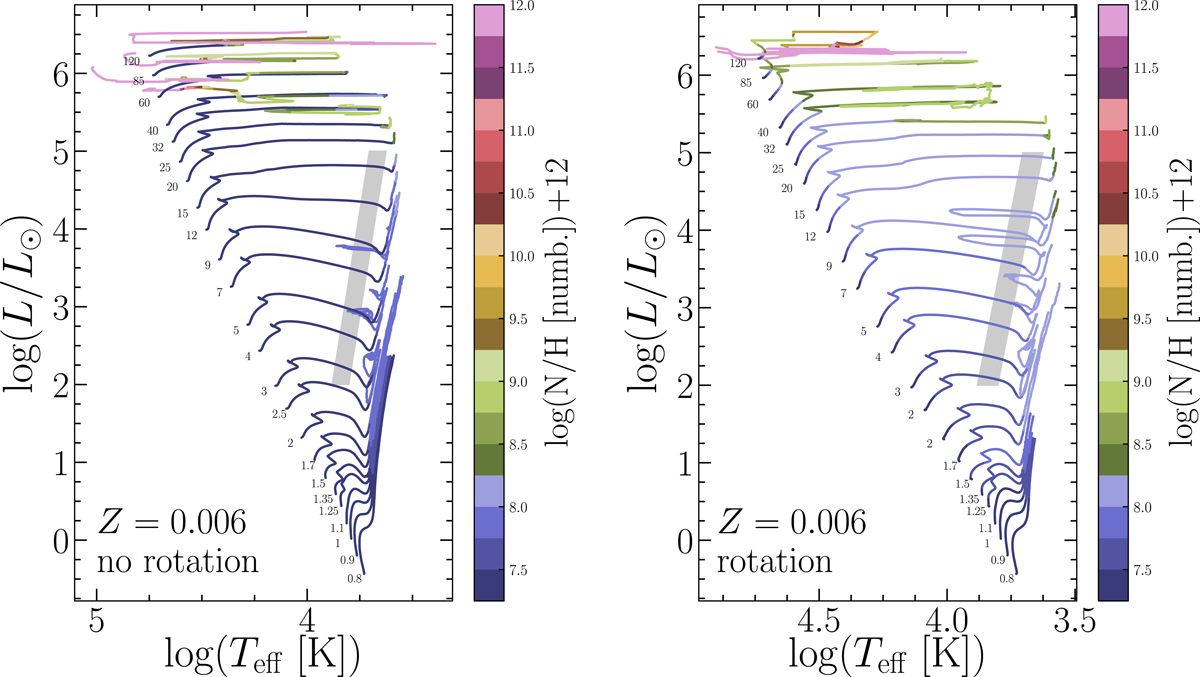
Fig. 2.

Evolutionary tracks for models with an initial mass between 0.8 and 120 M⊙ with a mass fraction of heavy element Z = 0.006. The colors along the tracks give an indication of the surface nitrogen to hydrogen ratios. The gray band shows the Cepheid instability strip. Left panel: nonrotating models. Right panel: rotating models with υini/υcrit = 0.4. The initial equatorial velocity on the ZAMS, as well as the time averaged velocity on the MS is given in the second and third column of Table A.1.
Current usage metrics show cumulative count of Article Views (full-text article views including HTML views, PDF and ePub downloads, according to the available data) and Abstracts Views on Vision4Press platform.
Data correspond to usage on the plateform after 2015. The current usage metrics is available 48-96 hours after online publication and is updated daily on week days.
Initial download of the metrics may take a while.


