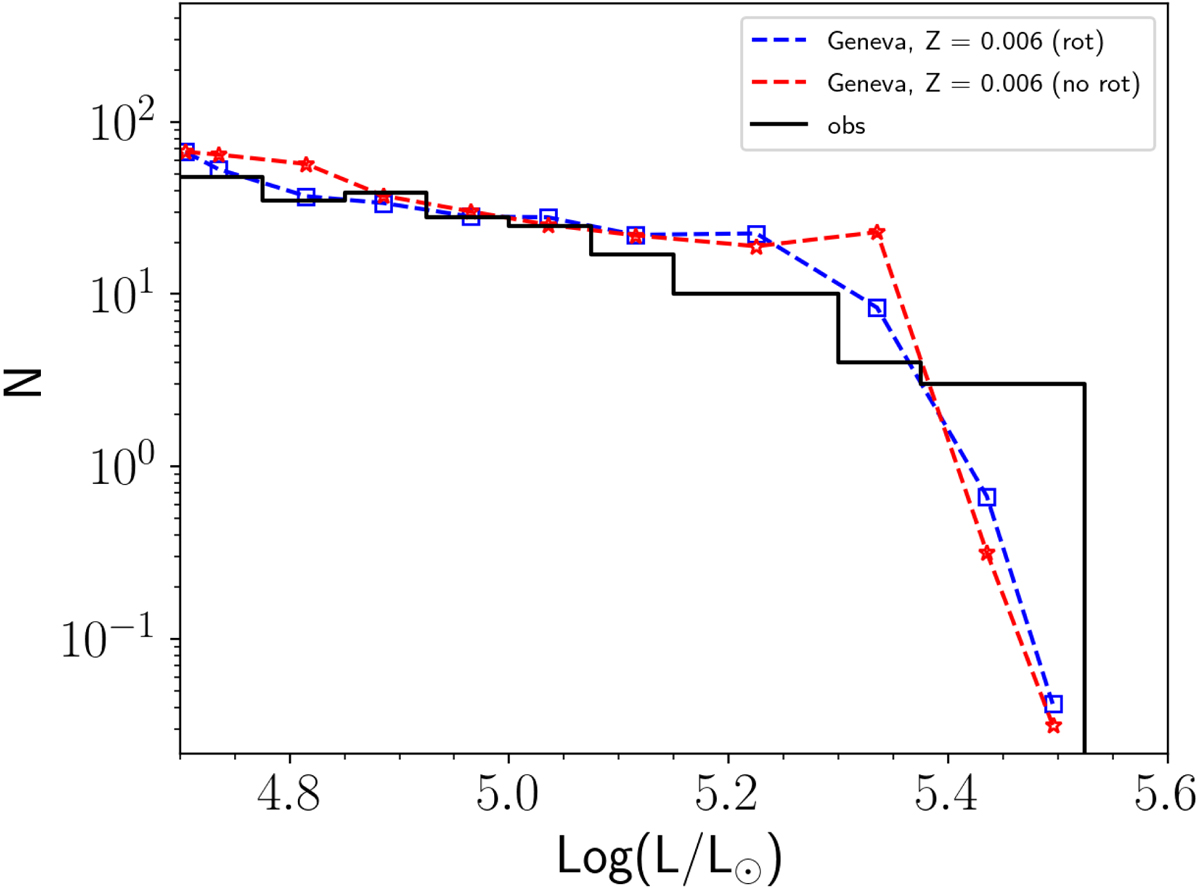
Fig. 11.

Luminosity function of red supergiants in the LMC. The black histogram shows the observed luminosity function as given in Davies et al. (2018, and see references therein) and using observations by Elias et al. (1985), van Loon et al. (2005), Buchanan et al. (2006), Bonanos et al. (2009, 2010), Neugent et al. (2010, 2012), González-Fernández et al. (2015), Goldman et al. (2017). The results of the population synthesis code SYCLIST (Georgy et al. 2014) using the present models at Z = 0.006 are shown for rotating (blue squares) and non rotating (red stars) models. The numbers of stars in the models have been normalized to reproduce the observed number of stars at a luminosity equal to log L/L⊙ = 5.0.
Current usage metrics show cumulative count of Article Views (full-text article views including HTML views, PDF and ePub downloads, according to the available data) and Abstracts Views on Vision4Press platform.
Data correspond to usage on the plateform after 2015. The current usage metrics is available 48-96 hours after online publication and is updated daily on week days.
Initial download of the metrics may take a while.


