Fig. 8.
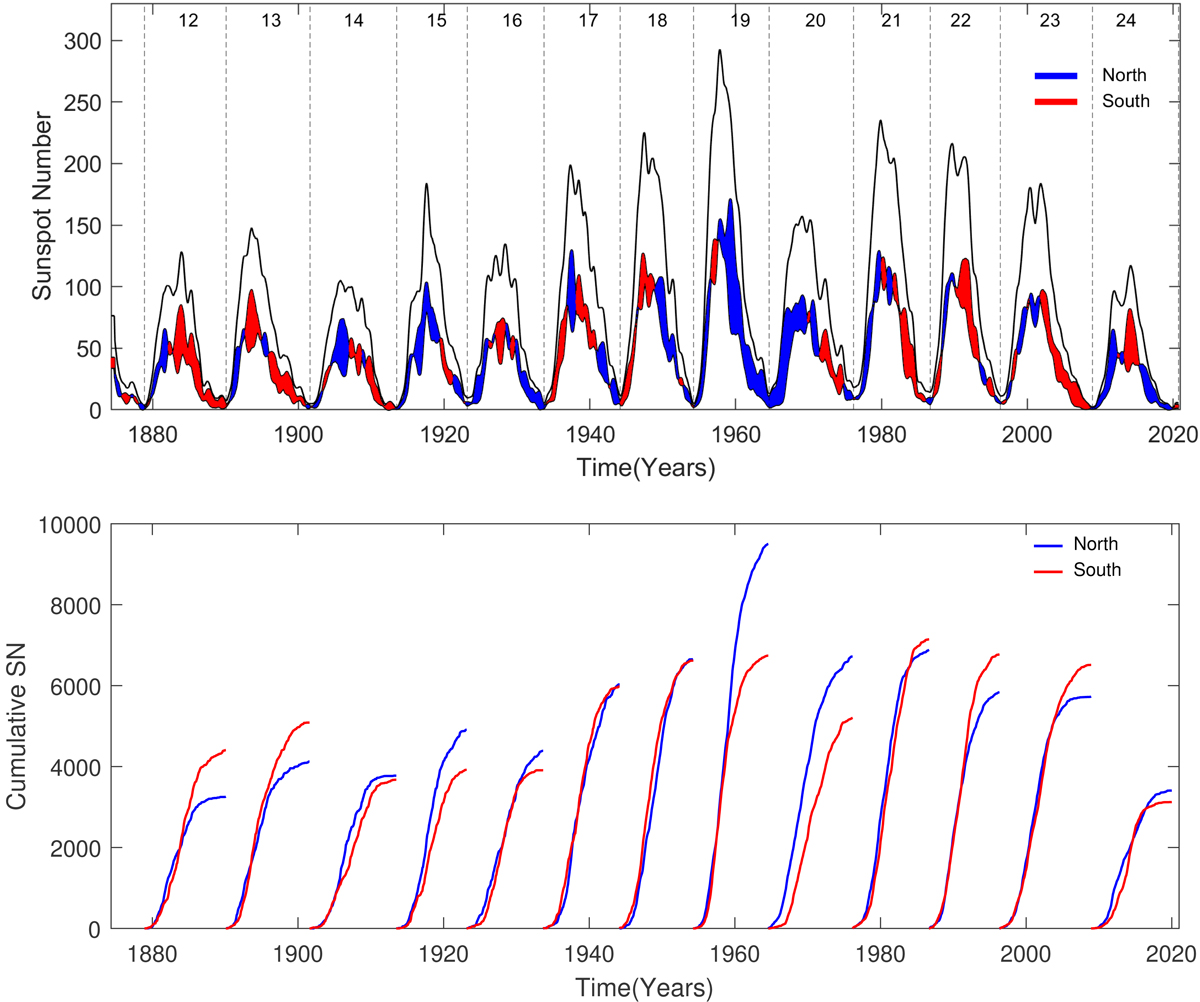
Top: smoothed monthly mean ISN (black) and HSN (north: blue, south: red) from the merged data set for the time range 1874–2020. The shading of the difference between the north and south sunspot numbers indicates the excess between them. Dashed vertical lines are drawn at sunspot minima to delineate the individual cycles. Bottom: cumulative monthly mean HSN calculated individually for each of the cycles 12–24.
Current usage metrics show cumulative count of Article Views (full-text article views including HTML views, PDF and ePub downloads, according to the available data) and Abstracts Views on Vision4Press platform.
Data correspond to usage on the plateform after 2015. The current usage metrics is available 48-96 hours after online publication and is updated daily on week days.
Initial download of the metrics may take a while.