Free Access
Fig. 7.
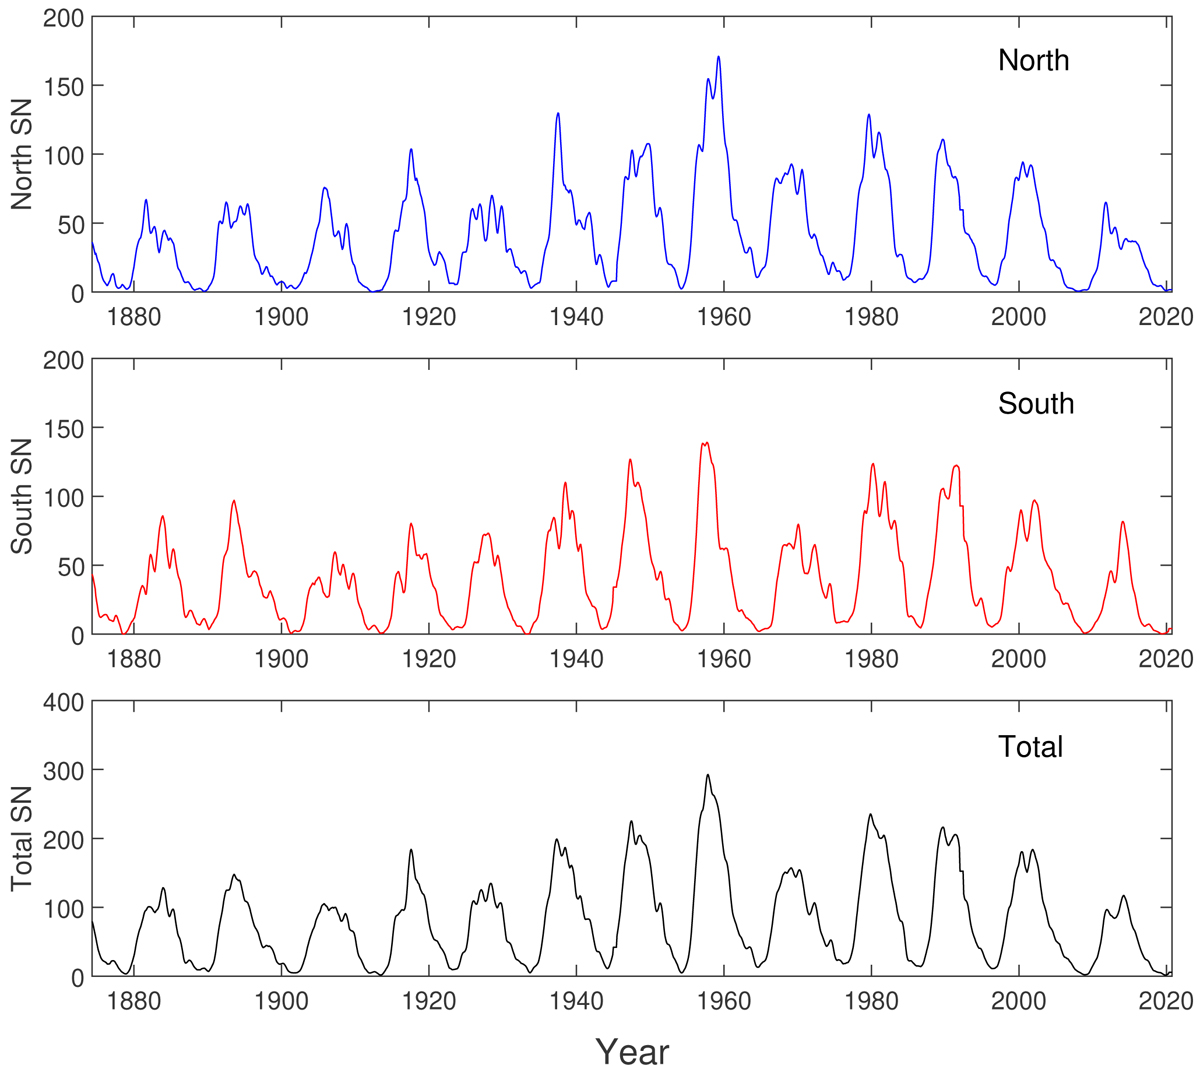
Final series of 13-month smoothed monthly mean HSNs derived for the period 1874–2020. Top: northern hemisphere. Middle: southern hemisphere. Bottom: total sunspot numbers.
Current usage metrics show cumulative count of Article Views (full-text article views including HTML views, PDF and ePub downloads, according to the available data) and Abstracts Views on Vision4Press platform.
Data correspond to usage on the plateform after 2015. The current usage metrics is available 48-96 hours after online publication and is updated daily on week days.
Initial download of the metrics may take a while.