Fig. 1.
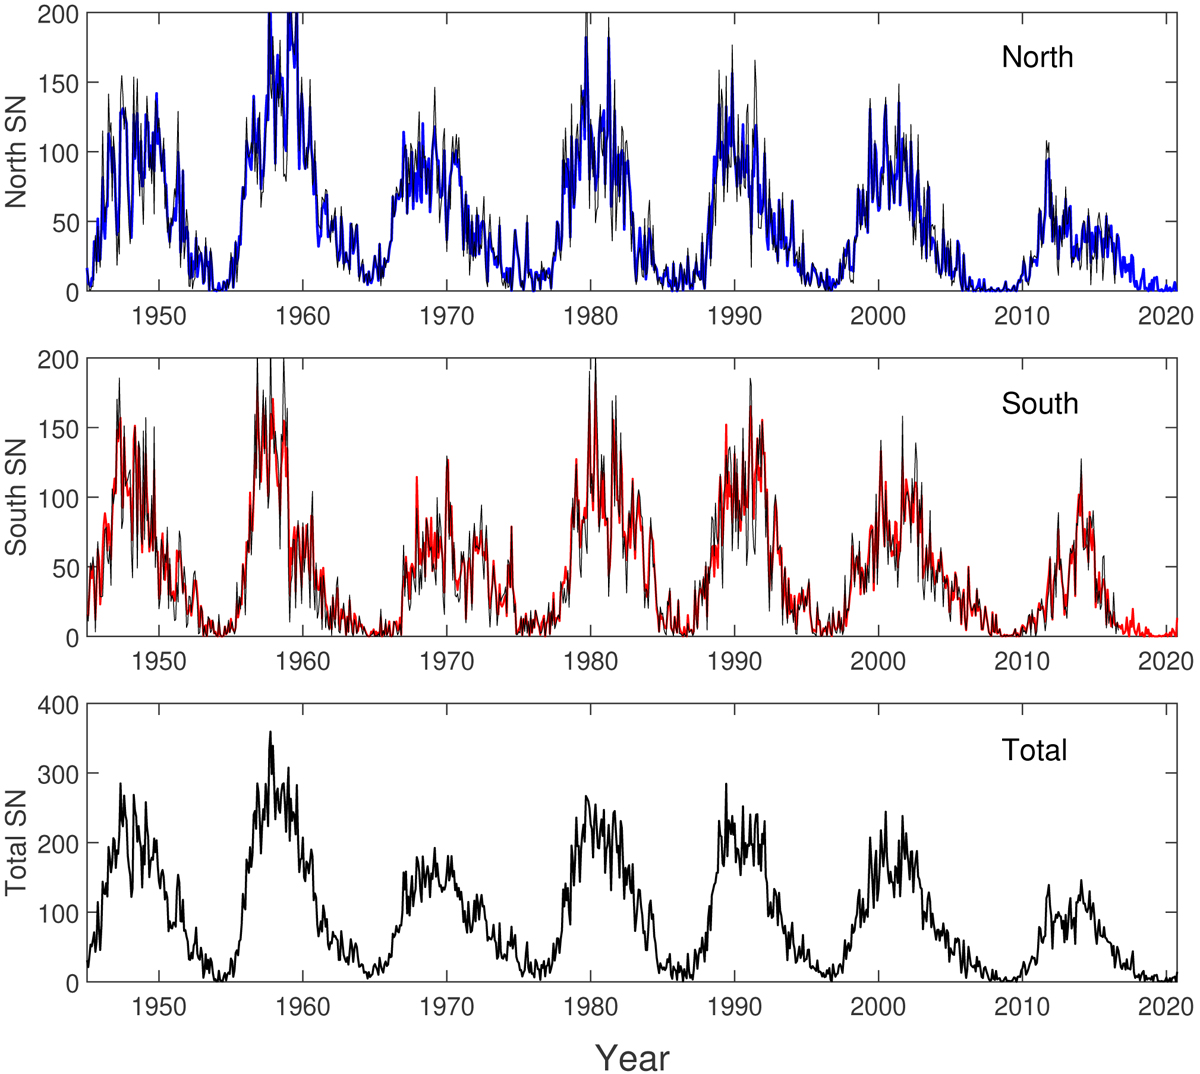
From top to bottom: monthly mean values of hemispheric north, south, and total sunspot numbers from 1945 to 2020. Top and middle panel: blue (red) curves show the north (south) HSN series combined from T06 and SILSO, whereas the black curves show the HSNs reconstructed from the sunspot areas (available up to September 2016).
Current usage metrics show cumulative count of Article Views (full-text article views including HTML views, PDF and ePub downloads, according to the available data) and Abstracts Views on Vision4Press platform.
Data correspond to usage on the plateform after 2015. The current usage metrics is available 48-96 hours after online publication and is updated daily on week days.
Initial download of the metrics may take a while.