Fig. A.1
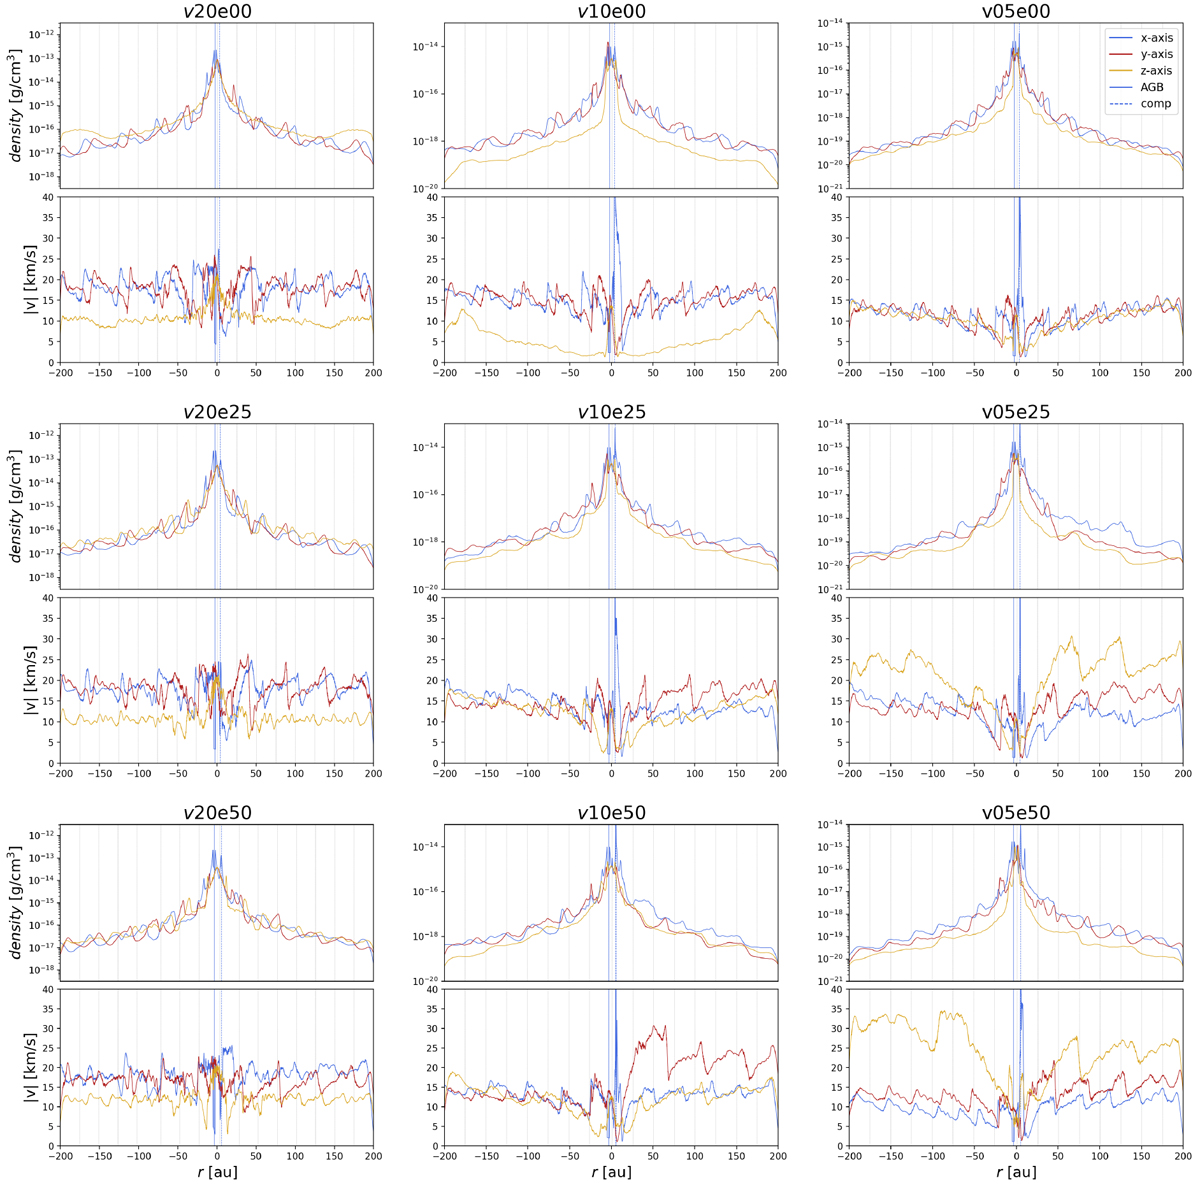
Density and velocity profiles on three perpendicular axes (x, y, and z) through the CoM for models with decreasing wind speed from left to right (vini = 20 km s−1, vini = 10 km s−1, vini = 5 km s−1) and with increasing eccentricity from top to bottom (e = 0.00, e = 0.25, e = 0.50). The solid and dotted vertical lines indicate the position of the AGB stars and of its companion, respectively. The density axes are scaled with respect to the input mass-loss rate for an optimal comparison.
Current usage metrics show cumulative count of Article Views (full-text article views including HTML views, PDF and ePub downloads, according to the available data) and Abstracts Views on Vision4Press platform.
Data correspond to usage on the plateform after 2015. The current usage metrics is available 48-96 hours after online publication and is updated daily on week days.
Initial download of the metrics may take a while.