Fig. 2.
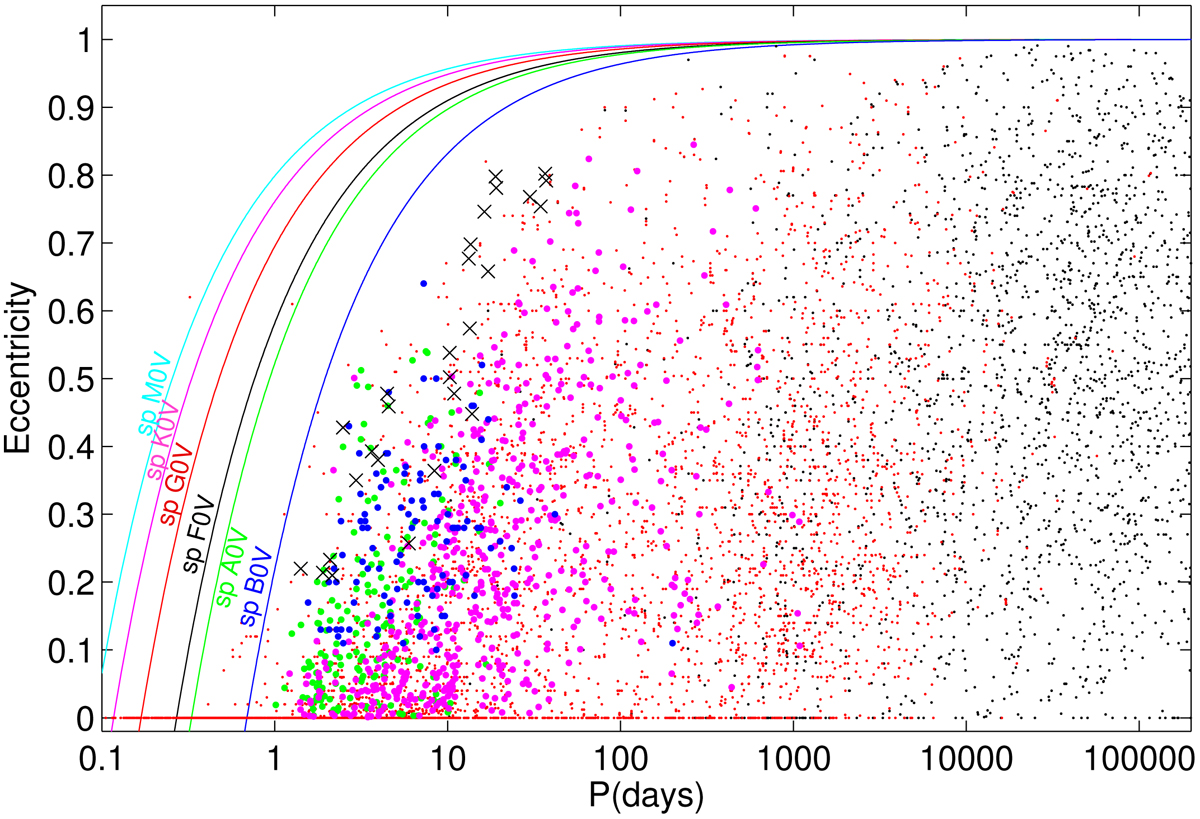
Period–eccentricity diagram. Small black points are the data from the Orbit Catalog of Visual Binaries (Hartkopf et al. 2001), and small red points denote the spectroscopic binaries from the SB9 catalogue (Pourbaix et al. 2004). Green dots show eclipsing binaries from the catalogue of eccentric binaries by Kim et al. (2018), magenta dots show Kepler binaries by Kjurkchieva et al. (2017), and blue dots show those from ASAS published by Shivvers et al. (2014). The highly eccentric systems of this study are shown by the crosses. The colour curves represent the approximate limits of very close periastron approaches of the two components (i.e., 1.5 × R⋆ = a ⋅ (1 − e) and the semimajor axis a taken from Kepler’s third law) when they should collide with each other. The periastron distances were calculated for different spectral types (B to M) according to their typical radii and masses (Pecaut & Mamajek 2013), with the assumption that the two components are similar to each other (same masses and radii).
Current usage metrics show cumulative count of Article Views (full-text article views including HTML views, PDF and ePub downloads, according to the available data) and Abstracts Views on Vision4Press platform.
Data correspond to usage on the plateform after 2015. The current usage metrics is available 48-96 hours after online publication and is updated daily on week days.
Initial download of the metrics may take a while.