Fig. 8.
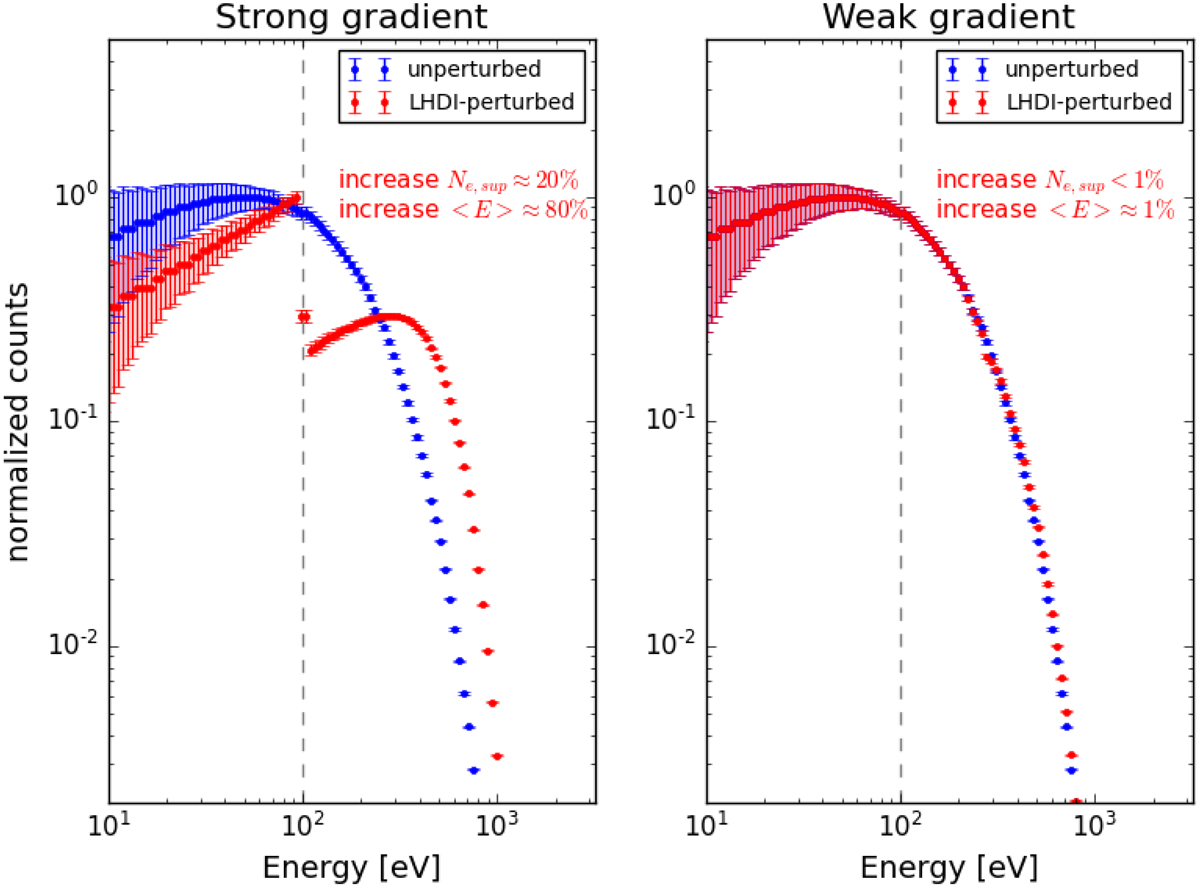
Instrumental response of the instrument MPPE/MEA simulated using our extended QL model for both strong ϵnρi = 1 and weak ϵnρi = 0.5 gradient cases (left and right panels), in the direction parallel to the magnetic field. Unperturbed electron distribution function using temperature Te = 50 eV in blue, and results of eQL model at time t = τNL in red. The dashed vertical line indicates the energy from which the supra-thermal electron density Ne, sup is computed.
Current usage metrics show cumulative count of Article Views (full-text article views including HTML views, PDF and ePub downloads, according to the available data) and Abstracts Views on Vision4Press platform.
Data correspond to usage on the plateform after 2015. The current usage metrics is available 48-96 hours after online publication and is updated daily on week days.
Initial download of the metrics may take a while.