Free Access
Fig. 4.
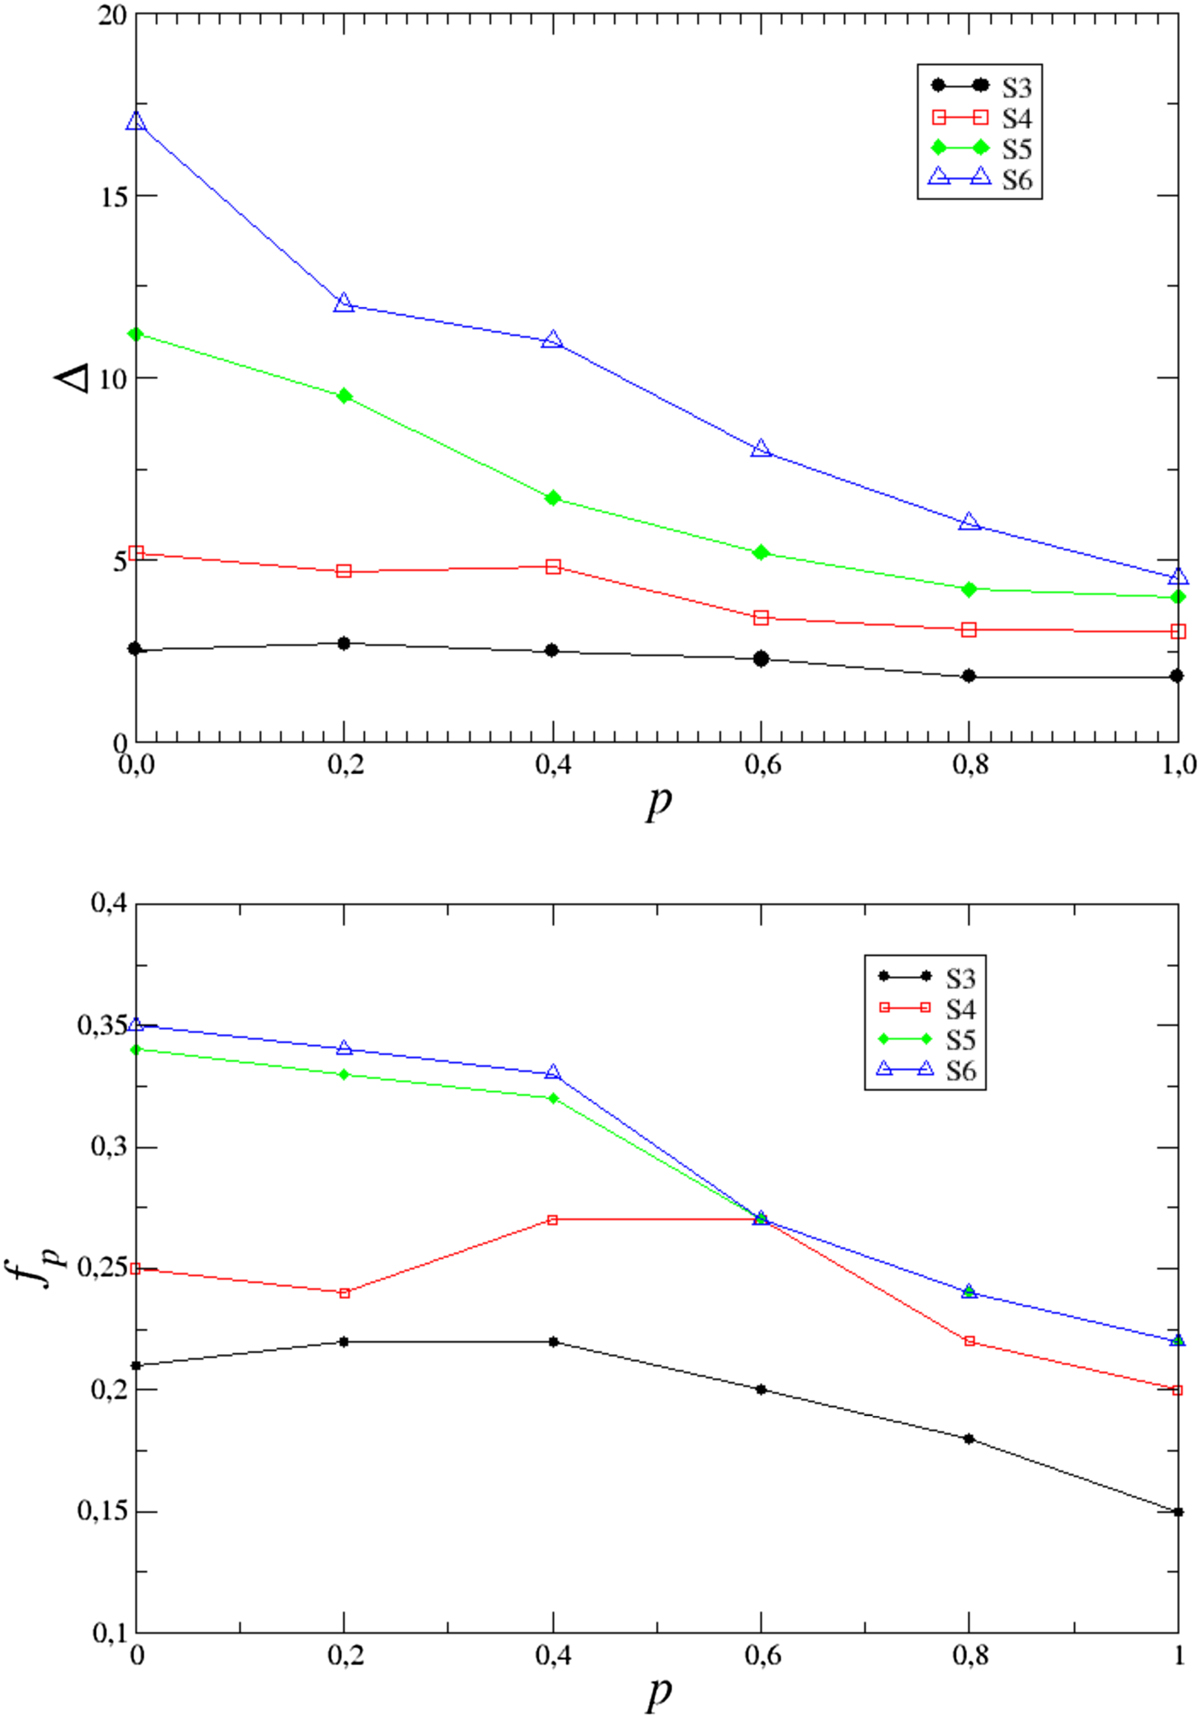
Quantifying the violence of the collapse. Upper panel: energy exchange Δ (see Eq. (4)) at time t = 9 as a function of p (with different N0). Bottom panel: same but the plotted quantity fp is the fraction of ejected particles, i.e., particles that have positive energy after the collapse.
Current usage metrics show cumulative count of Article Views (full-text article views including HTML views, PDF and ePub downloads, according to the available data) and Abstracts Views on Vision4Press platform.
Data correspond to usage on the plateform after 2015. The current usage metrics is available 48-96 hours after online publication and is updated daily on week days.
Initial download of the metrics may take a while.